Orange Workflows
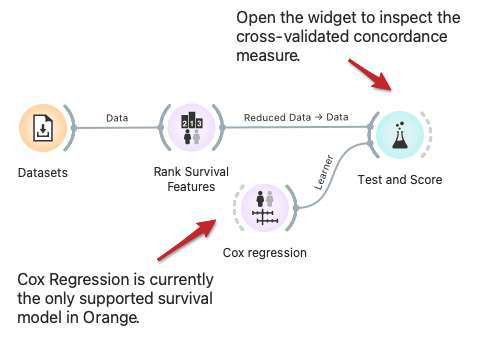
Cross Validation for Survival Models
Orange built-in methods for testing and scoring the predictive models now support survival-related models like Cox regression. Here we demonstrate cross-validation to estimate the concordance index for the Cox regression model trained on data instances from selected features.
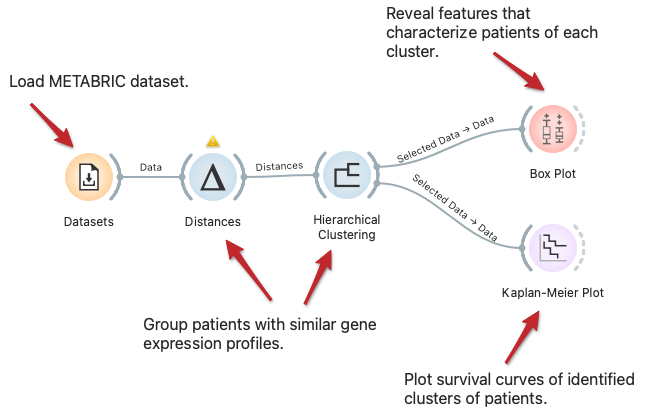
Explore Subpopulations with Distinct Risk Profiles
We can visualize the difference in subpopulations of breast cancer patients in the METABRIC dataset through clustering, that is, by identifying groups of data instances similar to each other. We can observe the difference in survival rate between clusters with Kaplan-Meier Plot and explore features that characterize patients of each cluster with the Box Plot widget.
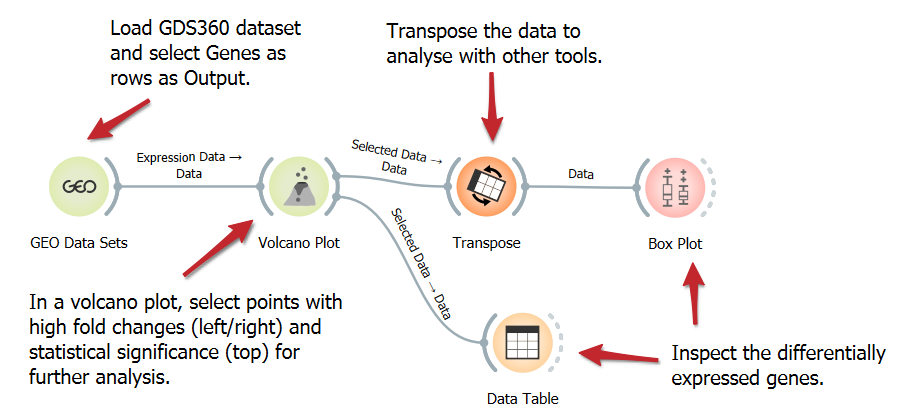
Identify Differentially Expressed Genes with Volcano Plot
Explore gene expression differences with a Volcano Plot in genomic analysis. Visualize significant upregulation or downregulation of genes between two conditions and identify critical genes with substantial changes and high statistical significance, potentially revealing key biomarkers or therapeutic targets.
Find Homologs for Differentially Expressed Genes
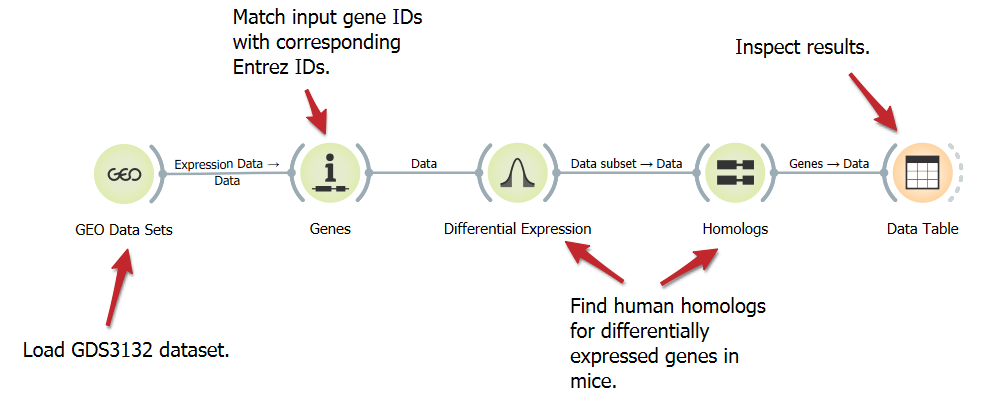
Homologous genes, although not identical, often perform analogous functions in different organisms. Here, we show a workflow that loads a mouse gene expression dataset, annotates the genes, select the top 100 differentially expressed genes, and finds their human homologs.
Score Overexpressed Genes in Individual Samples
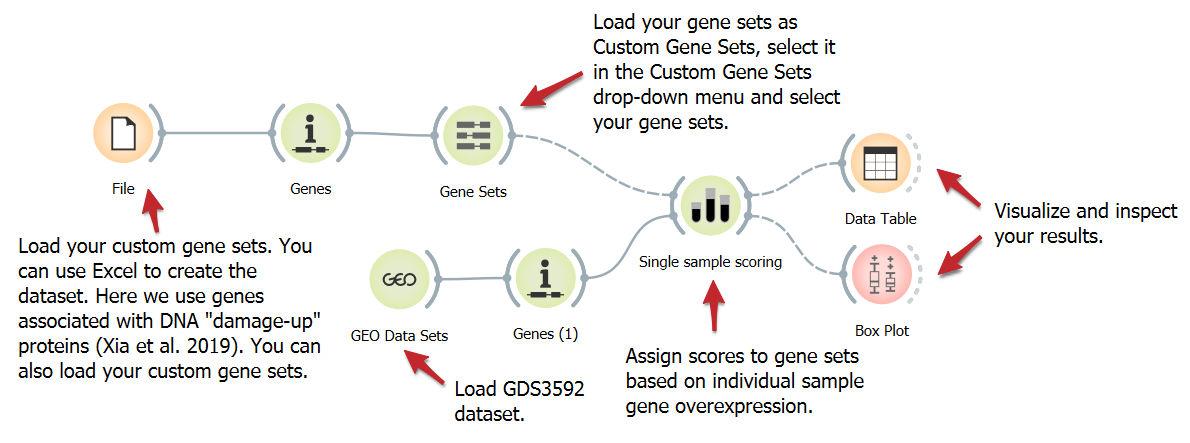
Studying specific genes linked to a biological process or disease can yield valuable insights. We present a workflow to analyze the expression of 284 human homologs of E.coli DNA damage-up proteins (DDPs). These DDPs fall into three gene sets: All DDPs, excluding known cancer drivers, and validated DDPs causing DNA damage in human cells. Enrichment scores are assigned using the Single Sample Scoring widget.
Cluster gene expression and enrichment
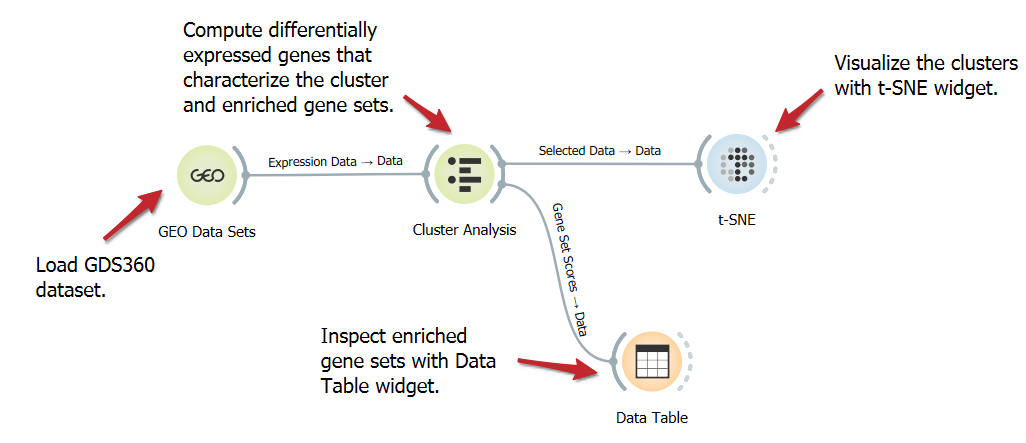
Analyzing the differential expression of genes characterizing clusters and enriched gene sets helps uncover specific molecular pathways and regulatory mechanisms that contribute to distinct biological functions or disease states. In this workflow, we use the Cluster Analysis to identify differentially expressed genes and the enriched gene sets that define the clusters.
Mental health of tech employees in times of COVID-19
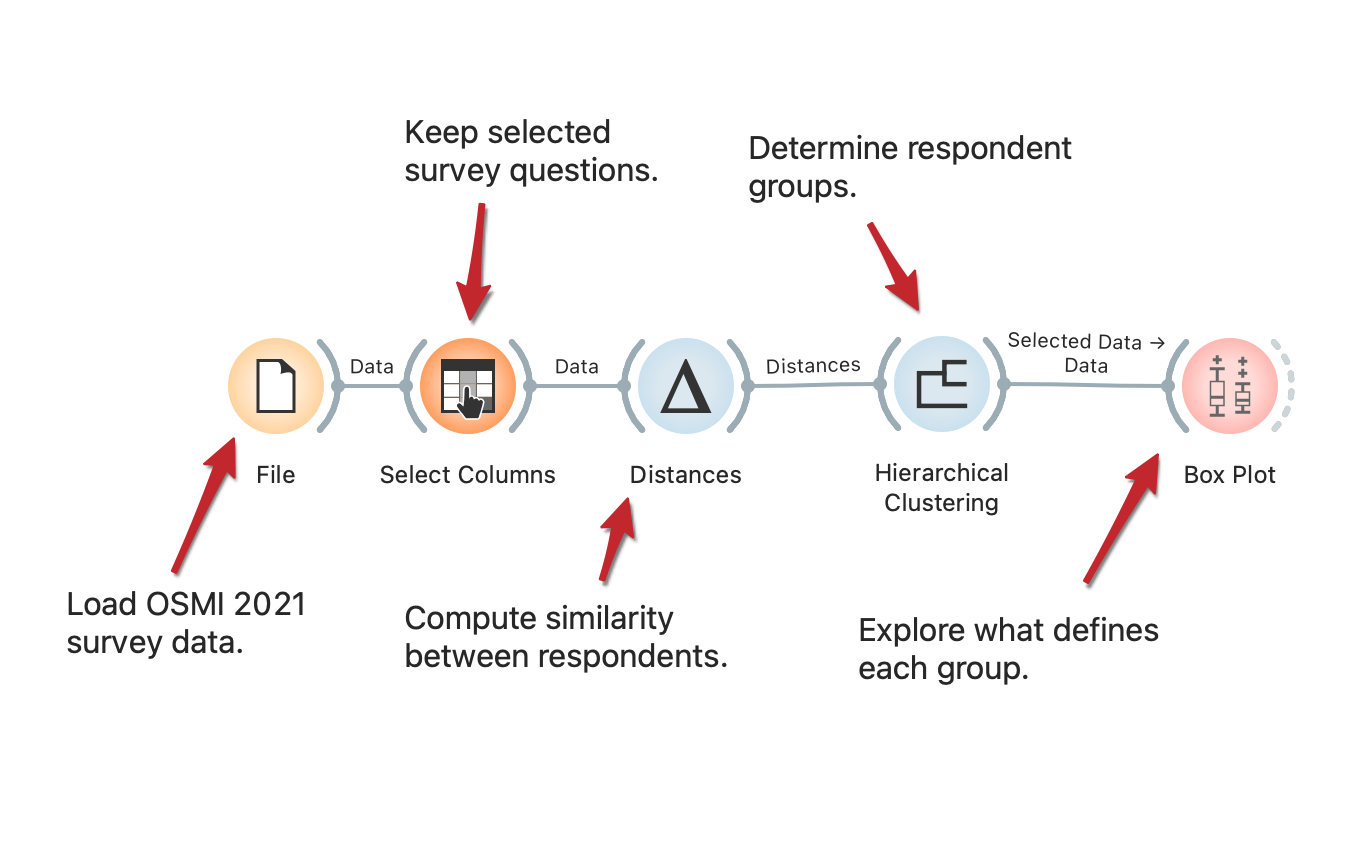
The COVID-19 pandemic brought about many societal changes, including a serious effect on mental health. The Open Sourcing Mental Health 2021 survey measures attitudes towards mental health in the tech workplace and examines the frequency of mental health disorders among tech workers. The workflow presents how to uncover different types of tech employees based on their responses. The procedure is fully described in the SAGE Ocean blog.
Annotate Cells Using Marker Genes
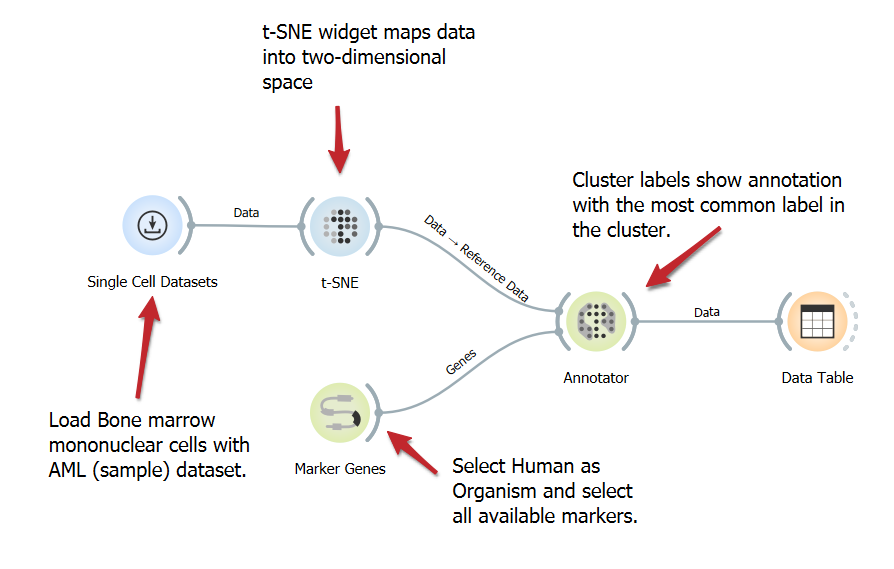
Annotating cells with marker genes identifies cell types, enhancing the understanding of functions and interactions in studies such as single-cell analysis. This workflow involves loading a single-cell dataset, identifying marker genes, and annotating cells based on gene expression, utilizing the t-SNE widget for visualization.
Gene Set Enrichment Analysis
Find gene sets overrepresented in a large group of genes, possibly associated with different phenotypes. Gene Set Enrichment Analysis widget provides a list of gene sets and their enrichment scores, and supports manual selection of gene sets.

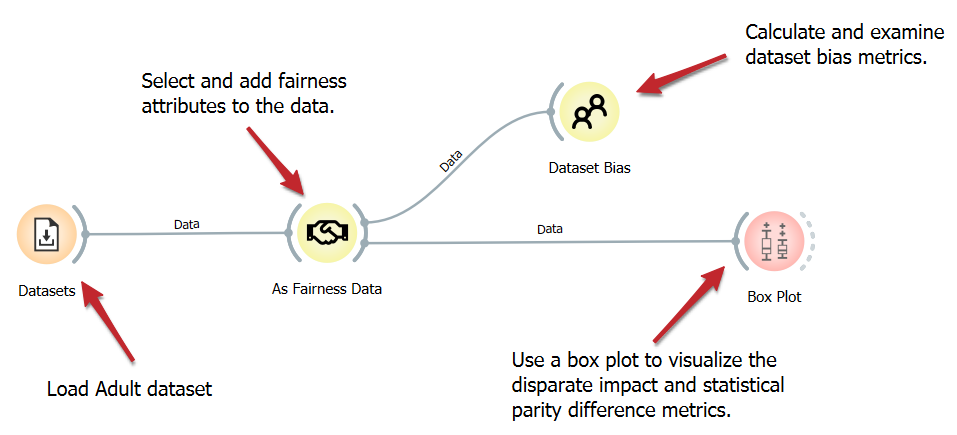
Dataset Bias Examination
Understanding the potential biases within datasets is crucial for fair machine-learning outcomes. This workflow detects dataset bias using a straightforward algorithm. After loading the dataset, we add specific fairness attributes to it, which are essential for our calculations. We then compute the fairness metrics via the Dataset Bias widget and explain the results in a Box Plot.
