Orange Workflows
Inspecting Outliers with Silhouette
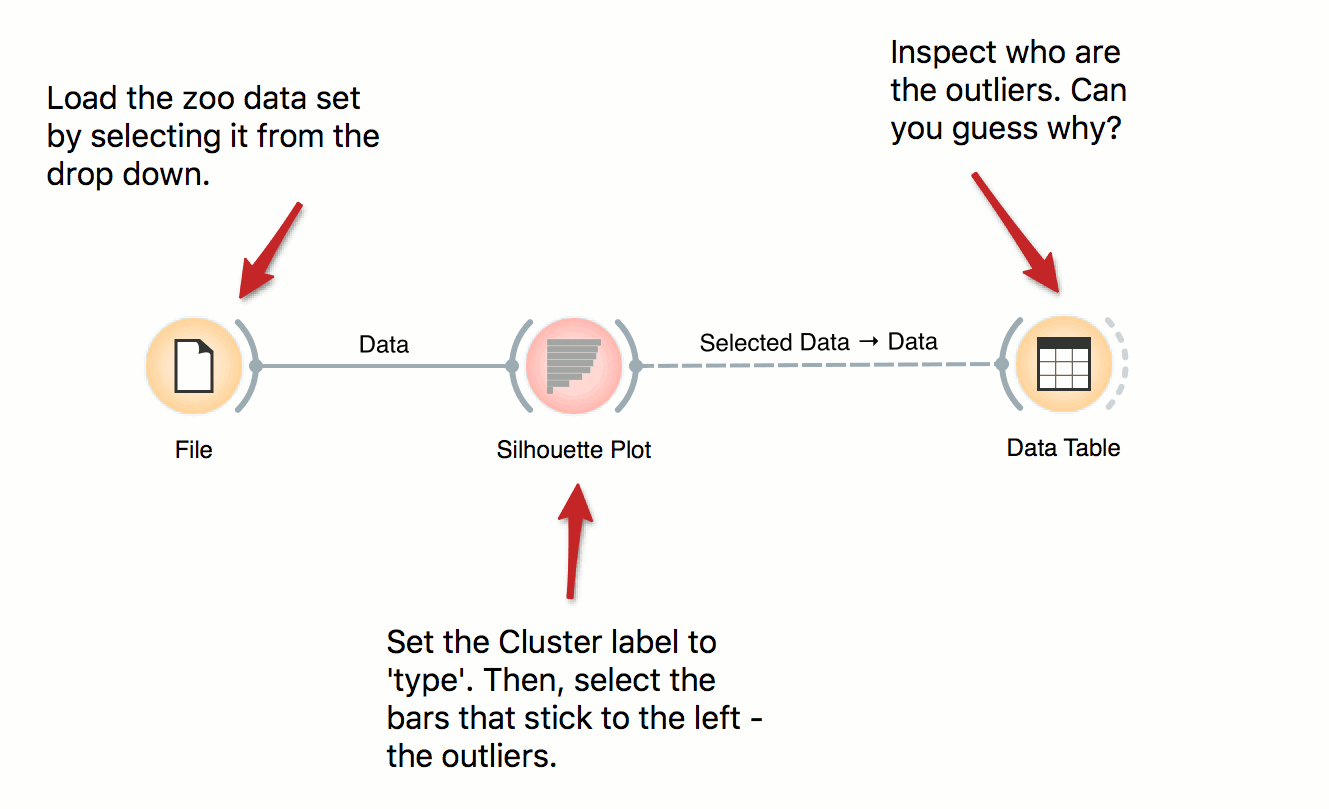
Silhouette Plot shows how ‘well-centered’ each data instance is with respect to its cluster or class label. In this workflow we use iris’ class labels to observe which flowers are typical representatives of their class and which are the outliers. Select instances left of zero in the plot and observe which flowers are these. Try connecting the selection with the Scatter Plot to highlight the outliers.

