Orange Workflows
Hierarchical Clustering
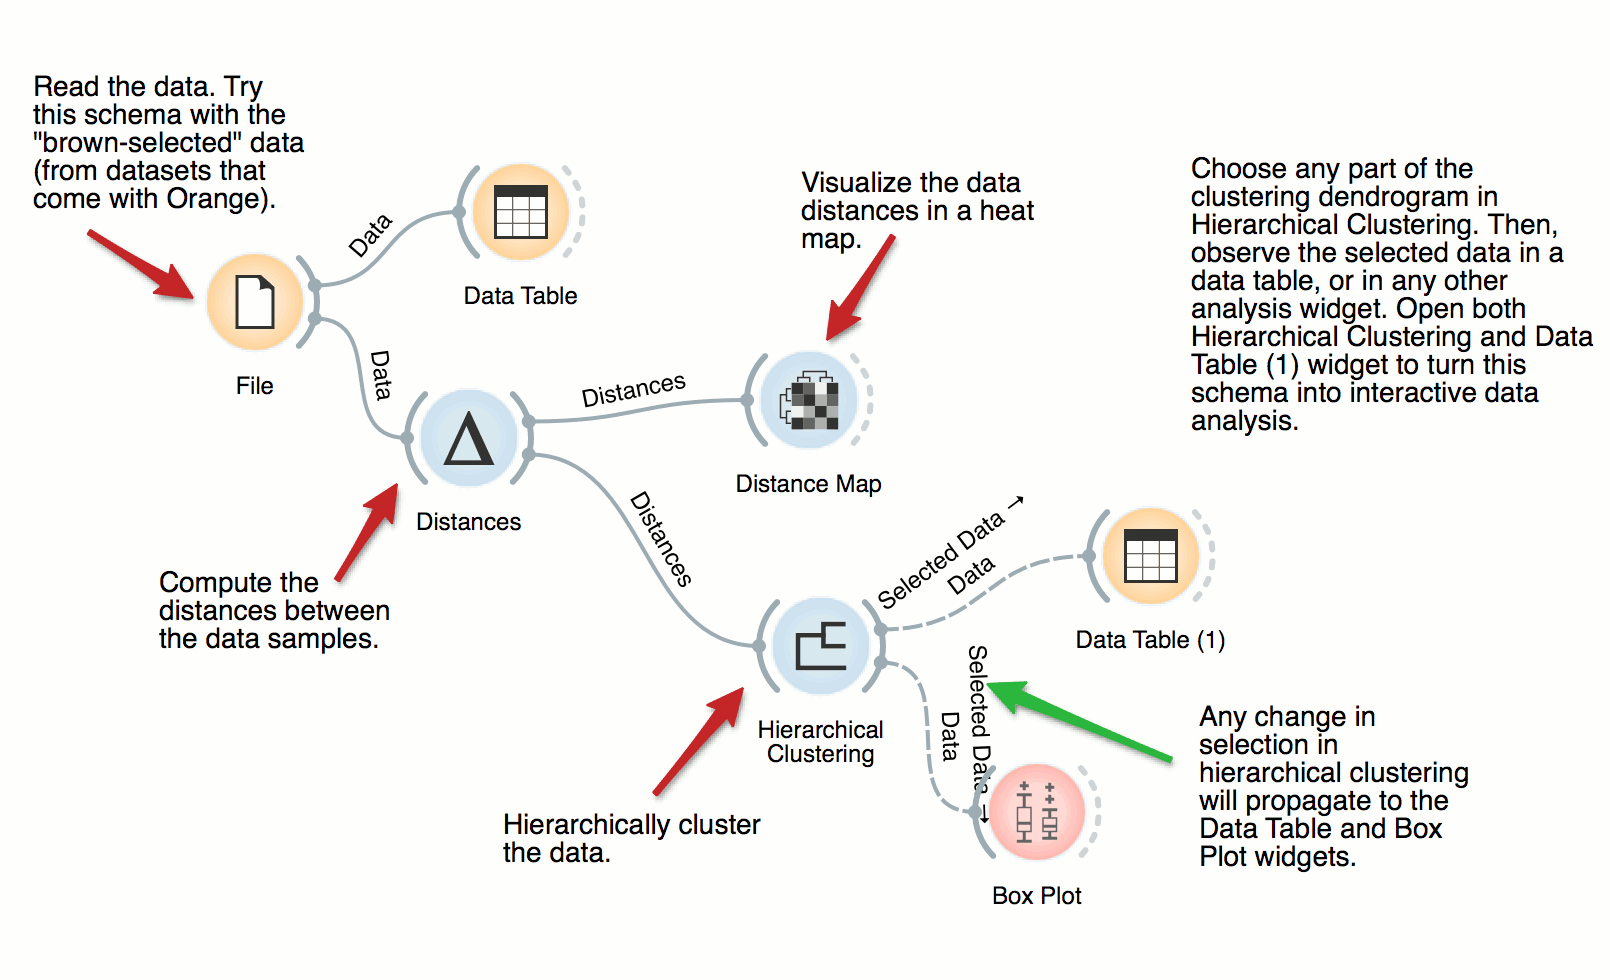
The workflow clusters the data items in iris dataset by first examining the distances between data instances. Distance matrix is passed to Hierarchical Clustering, which renders the dendrogram. Select different parts of the dendrogram to further analyze the corresponding data.

Cluster Inspection
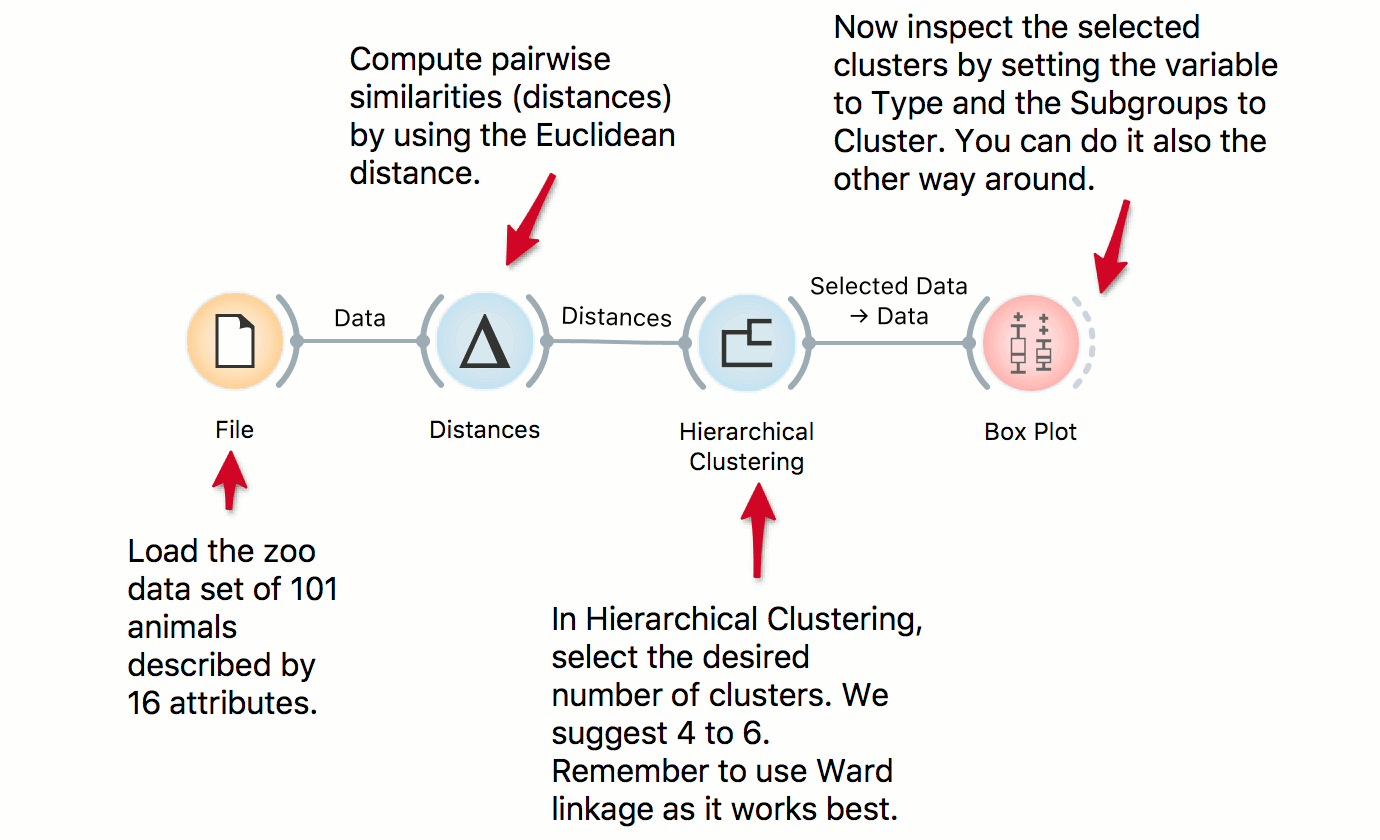
We use the zoo data set in combination with Hierarchical Clustering to discover groups of animals. Now that we have the clusters we want to find out what is significant for each cluster! Pass the clusters to Box Plot and use ‘Order by relevance’ to discover what defines a cluster. Seems like they are well-separated by the type, even though the clustering was unaware of the class label!

Explore Subpopulations with Distinct Risk Profiles
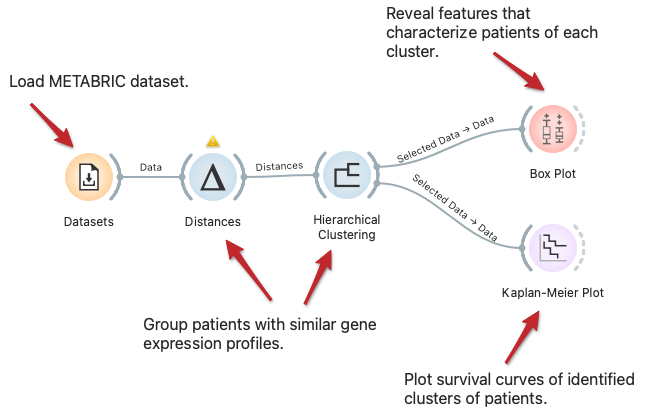
We can visualize the difference in subpopulations of breast cancer patients in the METABRIC dataset through clustering, that is, by identifying groups of data instances similar to each other. We can observe the difference in survival rate between clusters with Kaplan-Meier Plot and explore features that characterize patients of each cluster with the Box Plot widget.

Mental health of tech employees in times of COVID-19
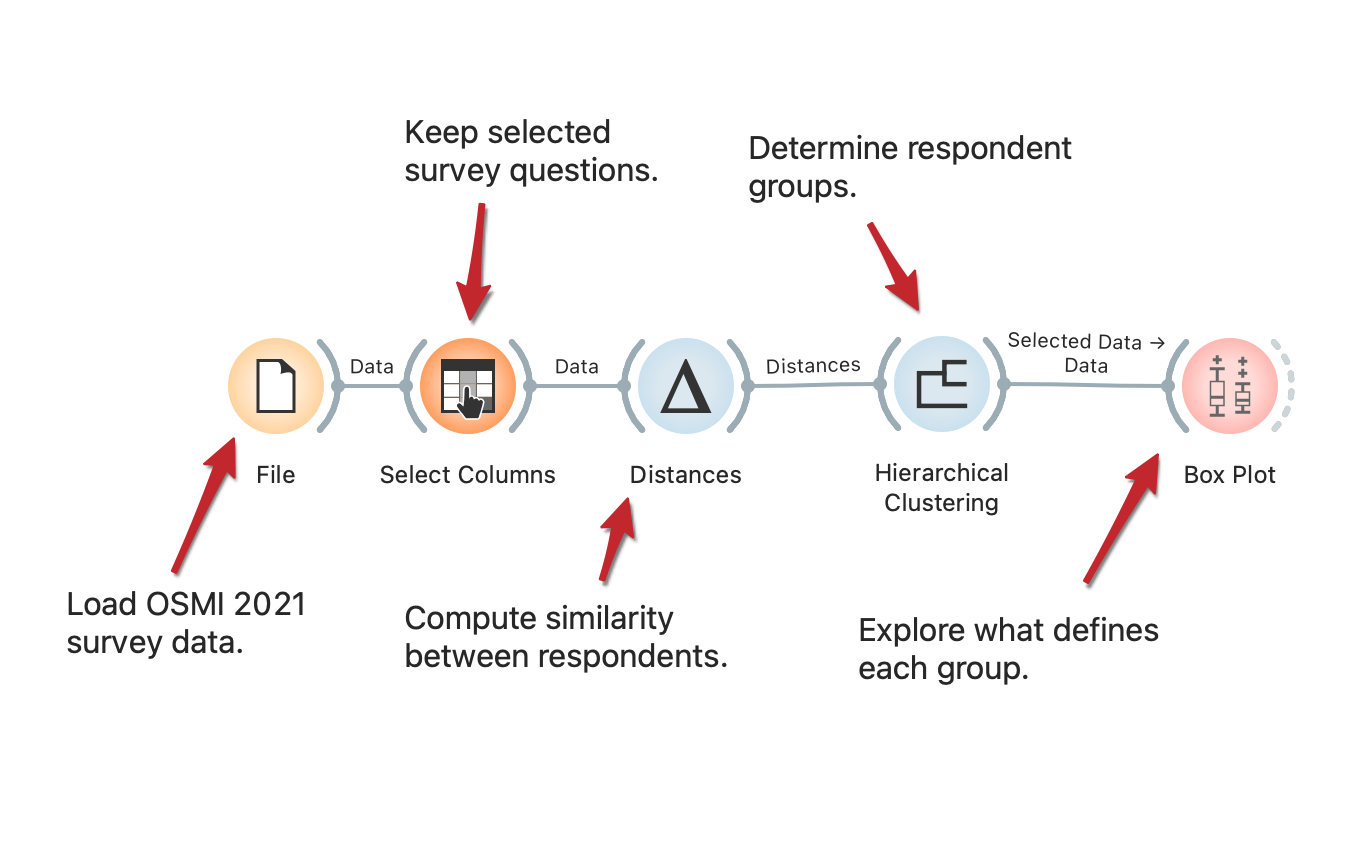
The COVID-19 pandemic brought about many societal changes, including a serious effect on mental health. The Open Sourcing Mental Health 2021 survey measures attitudes towards mental health in the tech workplace and examines the frequency of mental health disorders among tech workers. The workflow presents how to uncover different types of tech employees based on their responses. The procedure is fully described in the SAGE Ocean blog.

