Orange Workflows
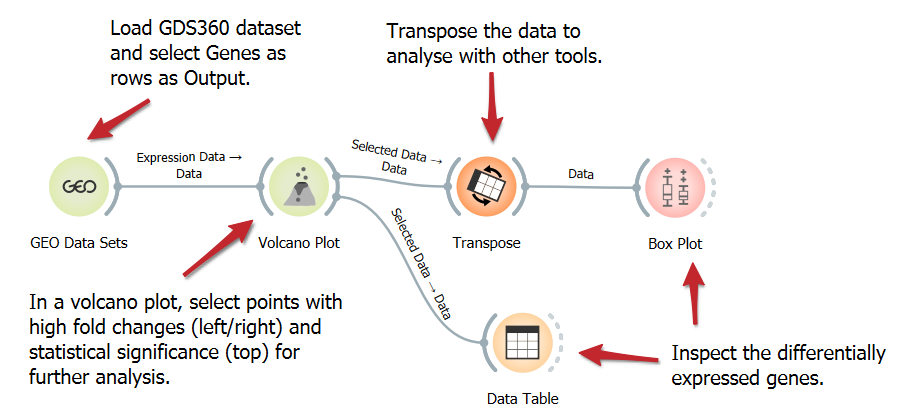
Identify Differentially Expressed Genes with Volcano Plot
Explore gene expression differences with a Volcano Plot in genomic analysis. Visualize significant upregulation or downregulation of genes between two conditions and identify critical genes with substantial changes and high statistical significance, potentially revealing key biomarkers or therapeutic targets.
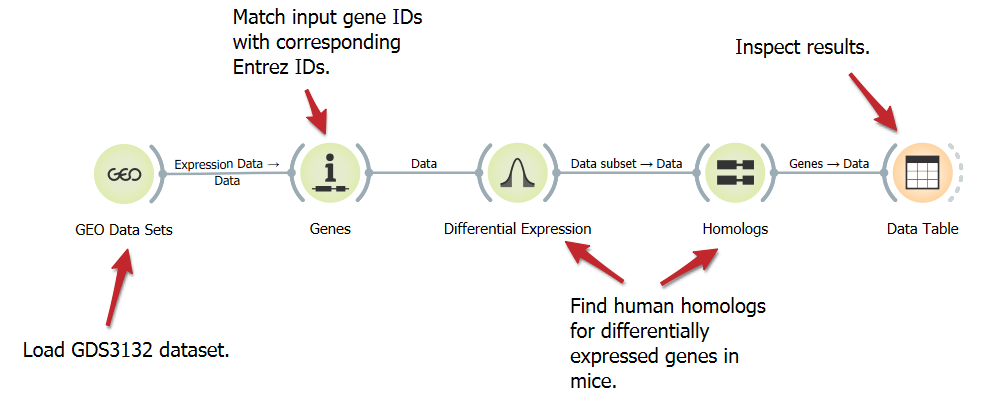
Find Homologs for Differentially Expressed Genes
Homologous genes, although not identical, often perform analogous functions in different organisms. Here, we show a workflow that loads a mouse gene expression dataset, annotates the genes, select the top 100 differentially expressed genes, and finds their human homologs.
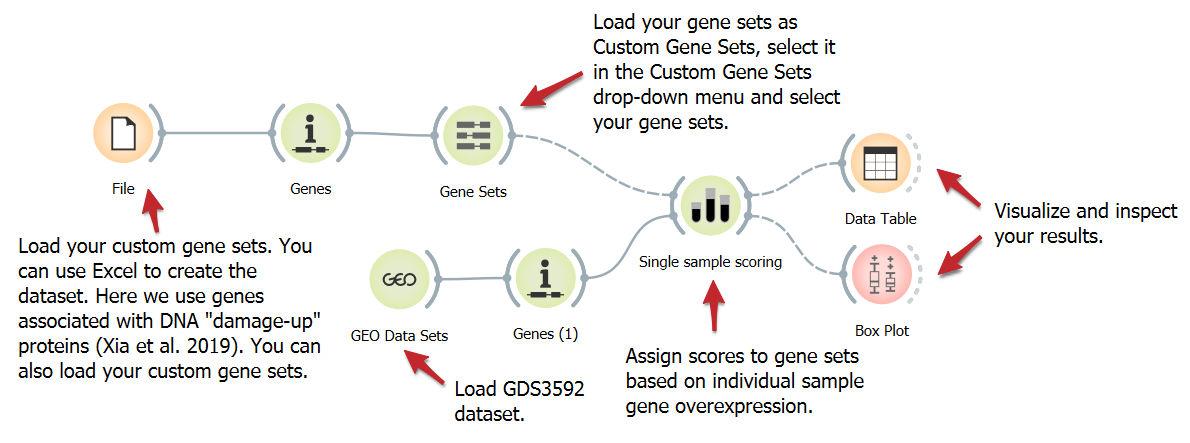
Score Overexpressed Genes in Individual Samples
Studying specific genes linked to a biological process or disease can yield valuable insights. We present a workflow to analyze the expression of 284 human homologs of E.coli DNA damage-up proteins (DDPs). These DDPs fall into three gene sets: All DDPs, excluding known cancer drivers, and validated DDPs causing DNA damage in human cells. Enrichment scores are assigned using the Single Sample Scoring widget.
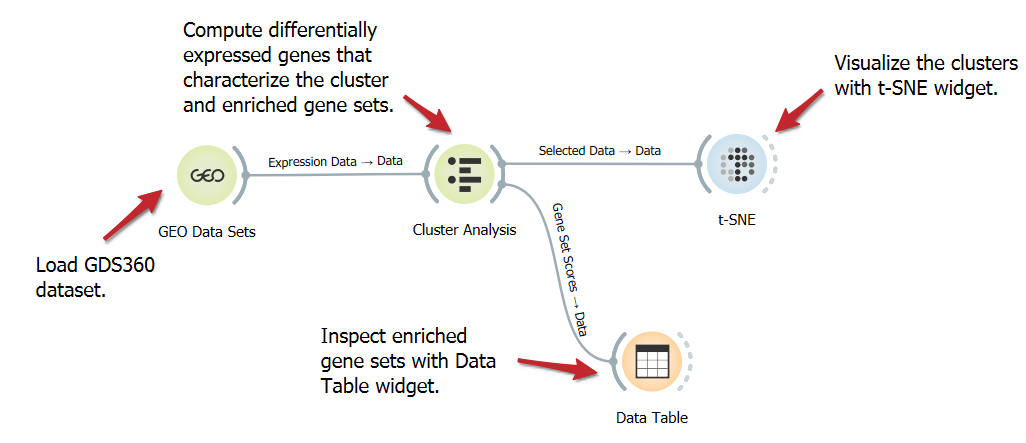
Cluster gene expression and enrichment
Analyzing the differential expression of genes characterizing clusters and enriched gene sets helps uncover specific molecular pathways and regulatory mechanisms that contribute to distinct biological functions or disease states. In this workflow, we use the Cluster Analysis to identify differentially expressed genes and the enriched gene sets that define the clusters.
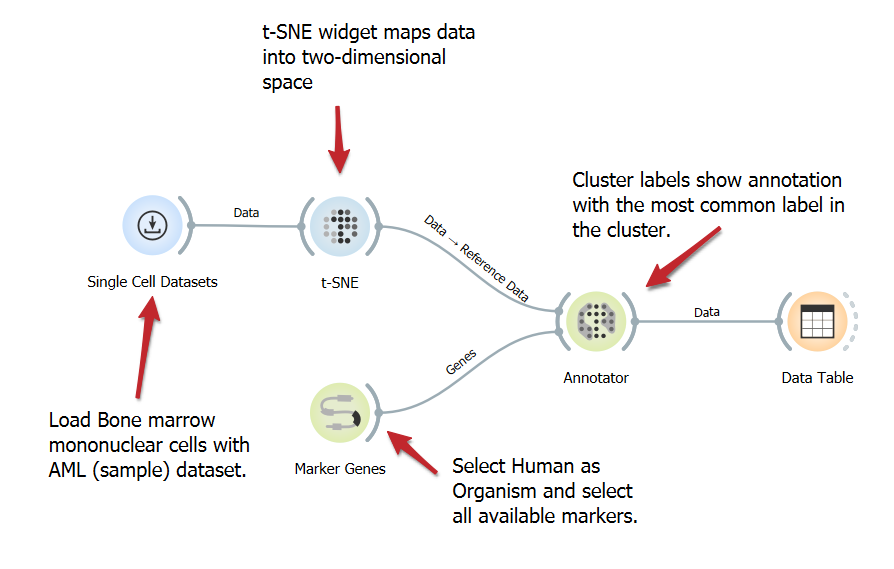
Annotate Cells Using Marker Genes
Annotating cells with marker genes identifies cell types, enhancing the understanding of functions and interactions in studies such as single-cell analysis. This workflow involves loading a single-cell dataset, identifying marker genes, and annotating cells based on gene expression, utilizing the t-SNE widget for visualization.
Gene Set Enrichment Analysis
Find gene sets overrepresented in a large group of genes, possibly associated with different phenotypes. Gene Set Enrichment Analysis widget provides a list of gene sets and their enrichment scores, and supports manual selection of gene sets.

