By: Ajda Pretnar Žagar, May 20, 2022
Confusion matrix for regression?
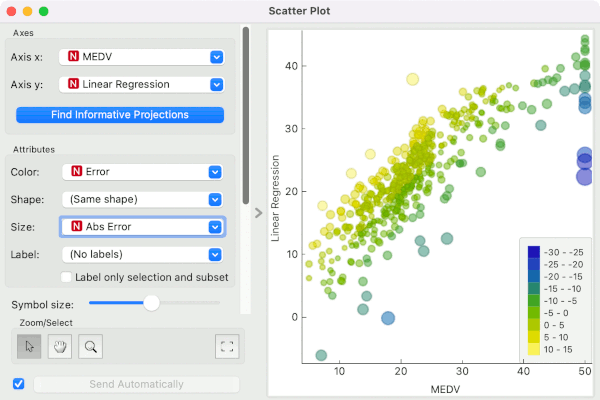
Confusion matrix shows classification error, but what is a suitable alternative for observing regression errors in Orange?
By: Ajda Pretnar Žagar, May 20, 2022
Confusion matrix shows classification error, but what is a suitable alternative for observing regression errors in Orange?
By: AJDA, Nov 3, 2017
We know you’ve missed it. We’ve been getting many requests to bring back Neural Network widget, but we also had many reservations about it. Neural networks are powerful and great, but to do them right is not straight-forward. And to do them right in the context of a GUI-based visual programming tool like Orange is a twisted double helix of a roller coaster. Do we make each layer a widget and then stack them?
By: AJDA, Apr 7, 2017
Did you recently wonder where did Classification Tree go? Or what happened to Majority? Orange 3.4.0 introduced a new widget category, Model, which now contains all supervised learning algorithms in one place and replaces the separate Classify and Regression categories. This, however, was not a mere cosmetic change to the widget hierarchy. We wanted to simplify the interface for new users and make finding an appropriate learning algorithm easier. Moreover, now you can reuse some workflows on different data sets, say housing.
By: BLAZ, Dec 22, 2016
It is the time of the year when we adore Christmas trees. But these are not the only trees we, at Orange team, think about. In fact, through almost life-long professional deformation of being a data scientist, when I think about trees I would often think about classification and regression trees. And they can be beautiful as well. Not only for their elegance in explaining the hidden patterns, but aesthetically, when rendered in Orange.
By: BLAZ, Mar 12, 2016
A week ago I used Orange to explain the effects of regularization. This was the second lecture in the Data Mining class, the first one was on linear regression. My introduction to the benefits of regularization used a simple data set with a single input attribute and a continuous class. I drew a data set in Orange, and then used Polynomial Regression widget (from Prototypes add-on) to plot the linear fit.
By: BLAZ, Dec 19, 2015
Feature scoring and ranking can help in understanding the data in supervised settings. Orange includes a number of standard feature scoring procedures one can access in the Rank widget. Moreover, a number of modeling techniques, like linear or logistic regression, can rank features explicitly through assignment of weights. Trained models like random forests have their own methods for feature scoring. Models inferred by these modeling techniques depend on their parameters, like type and level of regularization for logistic regression.
By: AJDA, Oct 2, 2015
Biolab is currently hosting two amazing data scientists from the Tilburg University - dr. Marie Nilsen and dr. Eric Postma, who are preparing a 20-lecture MOOC on data science for non-technical audience. A part of the course will use Orange. The majority of their students is coming from humanities, law, economy and behavioral studies, thus we are discussing options and opportunities for adapting Orange for social scientists. Another great thing is that the course is designed for beginner level data miners, showcasing that anybody can mine the data and learn from it.
By: BIOLAB, Feb 2, 2012
Partial least squares regression is a regression technique which supports multiple response variables. PLS regression is very popular in areas such as bioinformatics, chemometrics etc. where the number of observations is usually less than the number of measured variables and where there exists multicollinearity among the predictor variables. In such situations, standard regression techniques would usually fail. The PLS regression is now available in Orange (see documentation)! You can use PLS regression model on single-target or multi-target data sets.
By: BIOLAB, Dec 20, 2011
There have recently been some additions to the lineup of Orange learners. One of these is Orange.regression.earth.EarthLearner. It is an Orange interface to the Earth library written by Stephen Milborrow implementing Multivariate adaptive regression splines. So lets take it out for a spin on a simple toy dataset (data.tab - created using the Paint Data widget in the Orange Canvas): import Orange from Orange.regression import earth import numpy from matplotlib import pylab as pl data = Orange.
By: BIOLAB, Aug 24, 2011
SimpleTreeLearner is an implementation of classification and regression trees that sacrifices flexibility for speed. A benchmark on 42 different datasets reveals that SimpleTreeLearner is 11 times faster than the original TreeLearner. The motivation behind developing a new tree induction algorithm from scratch was to speed up the construction of random forests, but you can also use it as a standalone learner. SimpleTreeLearner uses gain ratio for classification and MSE for regression and can handle unknown values.