Orange Blog

By: Primož Godec, Feb 11, 2022

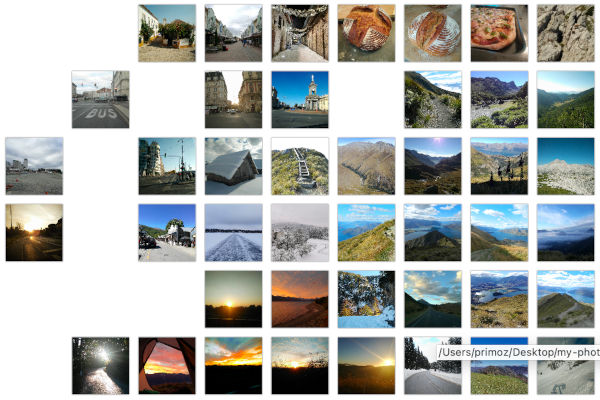
Editing the photographs collection with the help of machine learning

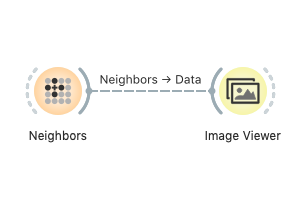
The core element of Orange's image analysis is embedding images in the vector space, which just became a feaster with our infrastructure upgrades. We use this opportunity to show possible ways of analyzing images through observing similar images and classifying them.


By: Blaž Zupan, Jan 8, 2020

Look-alike Images

We show how to use Neighbors widget on image embedding space to find image look-alikes.

Categories: neighbors images

By: AJDA, Feb 2, 2018

Image Analytics Workshop at AIUCD 2018

This week, Primož and I flew to the south of Italy to hold a workshop on Image Analytics through Data Mining at AIUCD 2018 conference. The workshop was intended to familiarize digital humanities researchers with options that visual programming environments offer for image analysis. In about 5 hours we discussed image embedding, clustering, finding closest neighbors and classification of images. While it is often a challenge to explain complex concepts in such a short time, it is much easier when working with Orange.


By: BLAZ, Sep 15, 2017

Orange at Station Houston

With over 262 member companies, Station Houston is the largest hub for tech startups in Houston. One of its members is also Genialis, a life science data exploration company that emerged from our lab and is now delivering pipelines and user-friendly apps for analytics in systems biology. Thanks to the invitation by the director of operations Alex de la Fuente, we gave a seminar on Data Science for Everyone. We spoke about how Orange can support anyone to learn about data science and then use machine learning on their own data.


By: BLAZ, Apr 25, 2017

Outliers in Traffic Signs

Say I am given a collection of images of traffic signs, and would like to find which signs stick out. That is, which traffic signs look substantially different from the others. I would assume that the traffic signs are not equally important and that some were designed to be noted before the others. I have assembled a small set of regulatory and warning traffic signs and stored the references to their images in a traffic-signs-w.


By: AJDA, Apr 3, 2017

Image Analytics: Clustering

Data does not always come in a nice tabular form. It can also be a collection of text, audio recordings, video materials or even images. However, computers can only work with numbers, so for any data mining, we need to transform such unstructured data into a vector representation. For retrieving numbers from unstructured data, Orange can use deep network embedders. We have just started to include various embedders in Orange, and for now, they are available for text and images.


By: AJDA, Nov 25, 2016

Celebrity Lookalike or How to Make Students Love Machine Learning

Recently we’ve been participating at Days of Computer Science, organized by the Museum of Post and Telecommunications and the Faculty of Computer and Information Science, University of Ljubljana, Slovenia. The project brought together pupils and students from around the country and hopefully showed them what computer science is mostly about. Most children would think programming is just typing lines of code. But it’s more than that. It’s a way of thinking, a way to solve problems creatively and efficiently.


By: AJDA, Sep 25, 2015

Save your graphs!

If you are often working with Orange, you probably have noticed a small button at the bottom of most visualization widgets. “Save Graph” now enables you to export graphs, charts, and hierarchical trees to your computer and use them in your reports. Because people need to see it to believe it! “Save Graph” will save visualizations to your computer. Save Graph function is available in Paint Data, Image Viewer, all visualization widgets, and a few others (list is below).


By: BIOLAB, Apr 29, 2014

Viewing Images

I am lately having fun with Image Viewer. The widget has been recently updated and can display images stored locally or on the internet. But wait, what images? How on earth can Orange now display images if it can handle mere tabular or basket-based data? Here’s an example. I have considered a subset of animals from the [download id=“864”] data set (comes with Orange installation), and for demonstration purposes selected only a handful of attributes.