By: Ajda Pretnar, Jun 3, 2019
Gene Expression Profiles with Line Plot
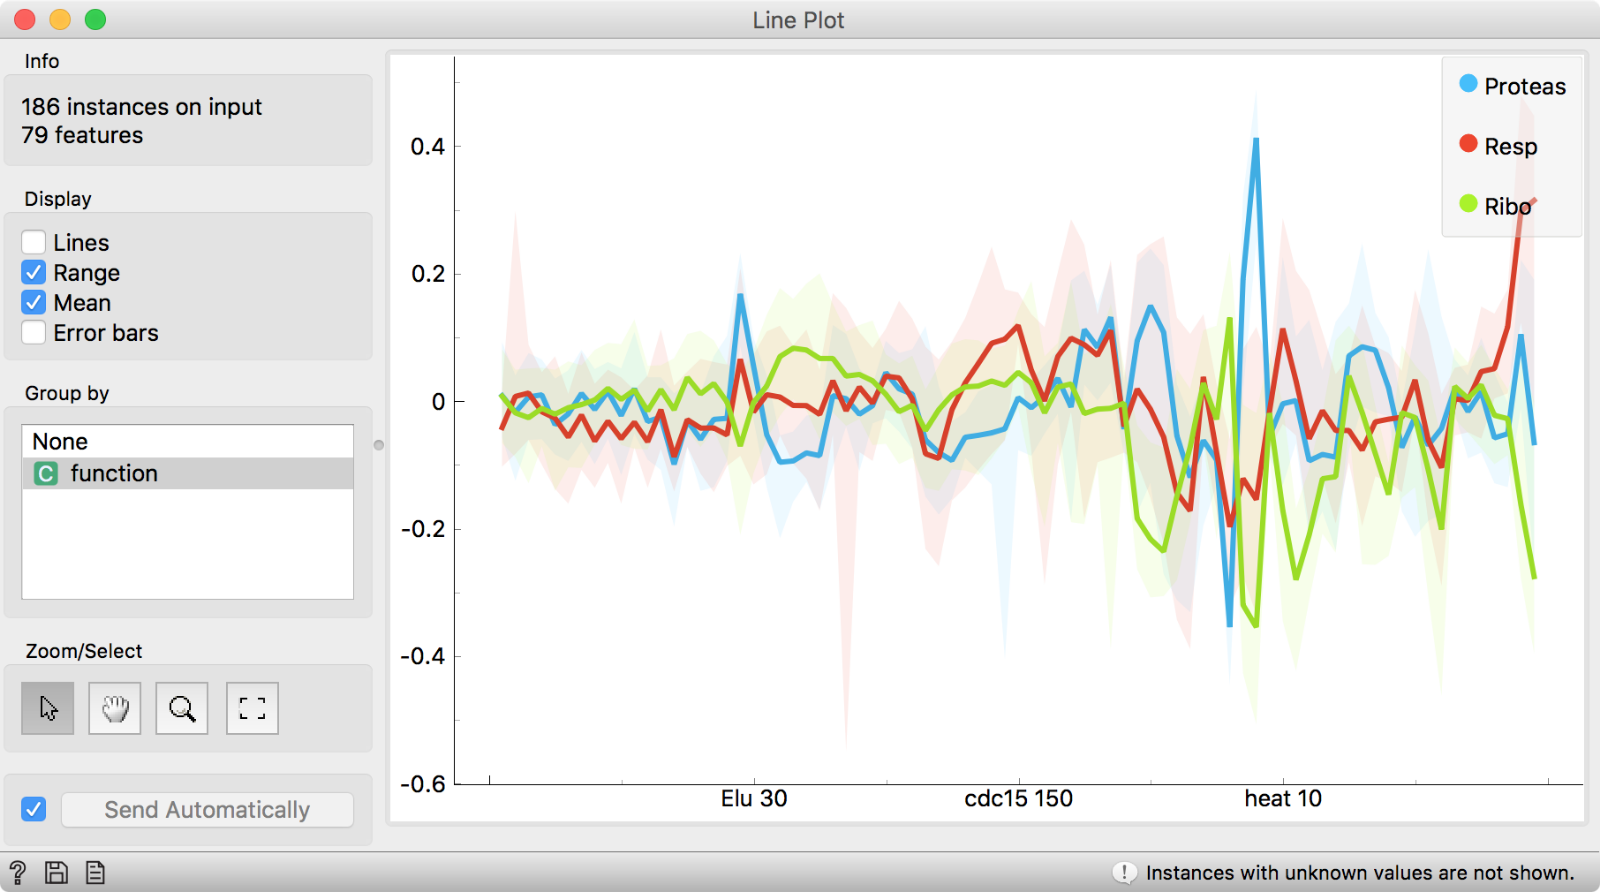
Line Plot shows profiles of data instances – each instance is a line in the plot and its profile are values across all variables in the data. We show how to explore gene expression profiles.