By: Blaž Zupan, Oct 21, 2021
Characterizing Clusters with a Box Plot
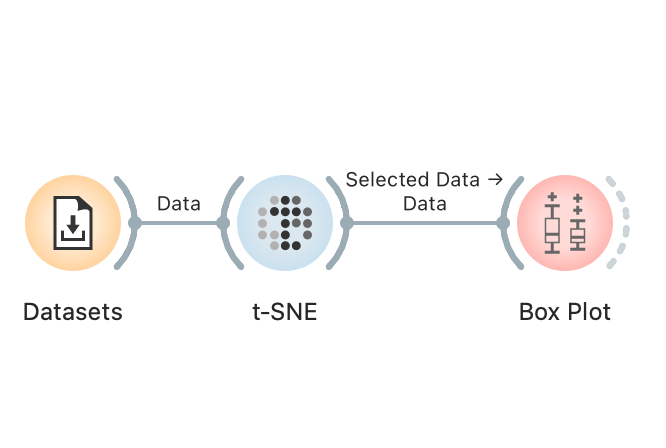
Box Plot widget offers a simple means for explaining clusters.
By: Blaž Zupan, Oct 21, 2021
Box Plot widget offers a simple means for explaining clusters.
By: Ajda Pretnar, Nov 15, 2019
Explaining customer base for businesses to make informed decisions. We present the case for Telco companies.

By: AJDA, Jul 17, 2018
Last week Blaž, Marko and I held a week long introductory Data Mining and Machine Learning course at the Ljubljana Doctoral Summer School 2018. We got a room full of dedicated students and we embarked on a journey through standard and advanced machine learning techniques, all presented of course in Orange. We have covered a wide array of topics, from different clustering techniques (hierarchical clustering, k-means) to predictive models (logistic regression, naive Bayes, decision trees, random forests), regression and regularization, projections, text mining and image analytics.
By: AJDA, Jun 21, 2018
This week we held our first Girls Go Data Mining workshop. The workshop brought together curious women and intuitively introduced them to essential data mining and machine learning concepts. Of course, we used Orange to explore visualizations, build predictive models, perform clustering and dive into text analysis. The workshop was supported by NumFocus through their small development grant initiative and we hope to repeat it next year with even more ladies attending!
By: AJDA, Nov 17, 2017
We’ve been having a blast with recent Orange workshops. While Blaž was getting tanned in India, Anže and I went to the charming Liverpool to hold a session for business school professors on how to teach business with Orange. Related: Orange in Kolkata, India Obviously, when we say teach business, we mean how to do data mining for business, say predict churn or employee attrition, segment customers, find which items to recommend in an online store and track brand sentiment with text analysis.
By: AJDA, Oct 26, 2017
Our streak of workshops continues. This time we taught professionals from public administration how they can leverage data analytics and machine learning to retrieve interesting information from surveys. Thanks to the Ministry of Public Administration, this is only the first in a line of workshops on data science we are preparing for public sector employees. For this purpose, we have designed EnKlik Anketa widget, which you can find in Prototypes add-on.
By: AJDA, Sep 22, 2017
Two days ago we held another Introduction to Data Mining workshop at our faculty. This time the target audience was a group of public sector professionals and our challenge was finding the right data set to explain key data mining concepts. Iris is fun, but not everyone is a biologist, right? Fortunately, we found this really nice data set with ballot counts from the Slovenian National Assembly (thanks to Parlameter).
By: BLAZ, Sep 15, 2017
With over 262 member companies, Station Houston is the largest hub for tech startups in Houston. One of its members is also Genialis, a life science data exploration company that emerged from our lab and is now delivering pipelines and user-friendly apps for analytics in systems biology. Thanks to the invitation by the director of operations Alex de la Fuente, we gave a seminar on Data Science for Everyone. We spoke about how Orange can support anyone to learn about data science and then use machine learning on their own data.
By: AJDA, Apr 3, 2017
Data does not always come in a nice tabular form. It can also be a collection of text, audio recordings, video materials or even images. However, computers can only work with numbers, so for any data mining, we need to transform such unstructured data into a vector representation. For retrieving numbers from unstructured data, Orange can use deep network embedders. We have just started to include various embedders in Orange, and for now, they are available for text and images.
By: AJDA, Mar 17, 2017
k-Means is one of the most popular unsupervised learning algorithms for finding interesting groups in our data. It can be useful in customer segmentation, finding gene families, determining document types, improving human resource management and so on. But… have you ever wondered how k-means works? In the following three videos we explain how to construct a data analysis workflow using k-means, how k-means works, how to find a good k value and how silhouette score can help us find the inliers and the outliers.