By: Primož Godec and Nikola Đukić, Oct 15, 2020
How to identify fake news with document embeddings
Presenting document embeddings widget and how to identify fake news.
By: Primož Godec and Nikola Đukić, Oct 15, 2020
Presenting document embeddings widget and how to identify fake news.
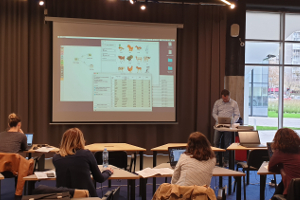
By: Ajda Pretnar, Nov 20, 2019
We explained how different models mean different things and how to interpret them at a recent tutorial in Belgrade.
By: AJDA, May 3, 2018
Janez and I have recently returned from a two-week stay in Moscow, Russian Federation, where we were teaching data mining to MA students of Applied Statistics. This is a new Master’s course that attracts the best students from different backgrounds and teaches them statistical methods for work in the industry. It was a real pleasure working at HSE. The students were proactive by asking questions and really challenged us to do our best.
By: AJDA, Jan 5, 2018
We all know that sometimes many is better than few. Therefore we are happy to introduce the Stack widget. It is available in Prototypes add-on for now. Stacking enables you to combine several trained models into one meta model and use it in Test&Score just like any other model. This comes in handy with complex problems, where one classifier might fail, but many could come up with something that works. Let’s see an example.
By: AJDA, Nov 29, 2017
On Monday we finished the second part of the workshop for the Statistical Office of Republic of Slovenia. The crowd was tough - these guys knew their numbers and asked many challenging questions. And we loved it! One thing we discussed was how to properly test your model. Ok, we know never to test on the same data you’ve built your model with, but even training and testing on separate data is sometimes not enough.
By: AJDA, Nov 3, 2017
We know you’ve missed it. We’ve been getting many requests to bring back Neural Network widget, but we also had many reservations about it. Neural networks are powerful and great, but to do them right is not straight-forward. And to do them right in the context of a GUI-based visual programming tool like Orange is a twisted double helix of a roller coaster. Do we make each layer a widget and then stack them?
By: BLAZ, Aug 11, 2017
Every fall I teach a course on Introduction to Data Mining. And while the course is really on statistical learning and its applications, I also venture into classification trees. For several reasons. First, I can introduce information gain and with it feature scoring and ranking. Second, classification trees are one of the first machine learning approaches co-invented by engineers (Ross Quinlan) and statisticians (Leo Breiman, Jerome Friedman, Charles J. Stone, Richard A.
By: AJDA, Aug 8, 2017
How do you explain text mining in 3 hours? Is it even possible? Can someone be ready to build predictive models and perform clustering in a single afternoon? It seems so, especially when Orange is involved. Yesterday, on August 7, we held a 3-hour workshop on text mining and text analysis for a large crowd of esteemed researchers at Digital Humanities 2017 in Montreal, Canada. Surely, after 3 hours everyone was exhausted, both the audience and the lecturers.
By: AJDA, Jun 5, 2017
One more exciting visualization has been introduced to Orange - a Nomogram. In general, nomograms are graphical devices that can approximate the calculation of some function. A Nomogram widget in Orange visualizes Logistic Regression and Naive Bayes classification models, and compute the class probabilities given a set of attributes values. In the nomogram, we can check how changing of the attribute values affect the class probabilities, and since the widget (like widgets in Orange) is interactive, we can do this on the fly.
By: AJDA, Apr 7, 2017
Did you recently wonder where did Classification Tree go? Or what happened to Majority? Orange 3.4.0 introduced a new widget category, Model, which now contains all supervised learning algorithms in one place and replaces the separate Classify and Regression categories. This, however, was not a mere cosmetic change to the widget hierarchy. We wanted to simplify the interface for new users and make finding an appropriate learning algorithm easier. Moreover, now you can reuse some workflows on different data sets, say housing.