Fairness in Machine Learning
Artificial intelligence and machine learning are increasingly used in everyday decisions that deeply impact individuals. This includes areas like employment, court sentencing, and credit application approvals. It’s crucial that these decision-making tools don’t favor certain demographic groups over others.
Bias in machine learning can stem from multiple sources. It might arise from skewed training data or the model’s design. This bias can result in unequal model outcomes: unprivileged groups might receive lower salaries despite having similar qualifications as privileged ones or face longer prison sentences for identical crimes. Such biases can significantly affect individuals’ lives.
For example, in the “Adult” dataset, a notable bias exists between male and female genders. When predicting if a person’s salary is “>50K” or “<=50K”, females tend to be classified as “<=50K” more frequently than their male counterparts with similar attributes. This disparity showcases the dataset’s bias, which can lead to biased and unfair predictions.
But why is it a problem to have models that reflect real-world bias?
In essence, machine learning models that merely mimic real-world biases perpetuate those biases, resulting in a vicious cycle. For instance, if we were to train a model on a dataset reflecting gender wage disparities and then use this model to automate salary decisions, we would reinforce the same disparity. This is not about denying the reality of the dataset but recognizing that our goal in AI and machine learning should be to achieve fairer, more equitable outcomes. If models are only used to replicate existing societal conditions, then we miss the opportunity for technology to be a force for positive change.
Furthermore, creating models that actively seek to reduce or eliminate bias is essential for maintaining trust in AI and machine learning systems. When people see these systems merely replicating past biases, they are less likely to trust and adopt them. In contrast, fairness-aware models can be trusted to make decisions that prioritize justice and equity over merely echoing the patterns in the data.
Recognizing these challenges, there has been a surge in efforts to mitigate this bias. The outcome has been the development of models that aim for balanced outcomes for all demographic groups or maintain consistent true positive rates across them. Mitigating bias might mean a slight dip in overall accuracy, but it is a necessary trade-off to ensure fairness in our models. Using fairness algorithms is ethical and highly beneficial to ensure people’s trust in machine learning and AI.
Introducing the Fairness add-on in Orange
Hopefully, the above has emphasized the importance of fairness in machine learning. With this in mind, let us discuss the new Orange fairness add-on. It aims to empower users with tools to detect and mitigate bias in machine-learning workflows. At the time of writing, the add-on includes seven widgets, four of which are used for bias detection and mitigation. The remaining three are used to support the other widgets and provide additional functionality.
In this blog and the following ones, we will familiarize ourselves with the add-on widgets and their use cases. We will also demonstrate how to use them in real-world scenarios and explain relevant concepts. Let us take a look at the first two widgets in more detail.
Exploring the Widgets: Dataset Bias and As Fairness
This blog will introduce the first two fairness widgets: As Fairness Data and Dataset Bias. Both aim to address the different bias identification and correction stages in machine learning workflows.
1. As Fairness Widget:
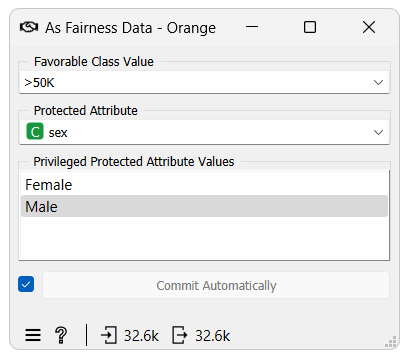
The As Fairness Widget does not do anything about fairness on its own. Instead, it allows users to designate fairness attributes in the dataset, which are essential for other fairness algorithms to operate.
When inputting a dataset into the widget, options for three attributes will appear:
Favorable Class Value: Define which class value is viewed as favorable.
Protected Attribute: Select the dataset feature representing or containing potentially biased groups or those for which fair predictions are desired, such as race, gender, or age.
Privileged Protected Attribute Values: Specify values within the protected attribute deemed privileged.

2. Dataset Bias Widget:
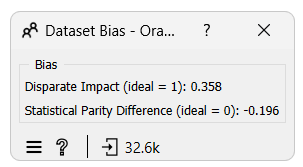
Before training a model, it is crucial to understand if the data itself is skewed. The Dataset Bias widget aids in precisely that. After giving it a dataset as input, the widget will calculate two fairness metrics according to the dataset:
- Disparate Impact (DI): Measures the ratio of favorable outcomes for an unprivileged group to that of the privileged group. An ideal value of 1.0 means the ratio of favorable outcomes is the same for both groups.
- DI < 1.0: The privileged group receives favorable outcomes at a higher rate.
- DI > 1.0: The privileged group receives favorable outcomes at a lower rate.
- Statistical Parity Difference (SPD): This is very similar to disparate impact. Instead of the ratio, it measures the difference in favorable outcomes between the unprivileged and the privileged groups. An ideal value for this metric is 0.
- SPD < 0: The privileged group has a higher rate of favorable outcomes.
- SPD > 0: The privileged group has a lower rate of favorable outcomes.

For anyone interested in learning more about these metrics, other fairness metrics and ai fairness in general, we recommend reading the article A Survey on Bias and Fairness in Machine Learning.
Orange use case
Now that we understand the functions of the As Fairness and Dataset Bias widgets, let us examine their application in a real-world scenario.
For this example, we will utilize the Adult dataset, which is among the most popular in the machine learning community. It consists of 48824 instances with 15 attributes describing demographic details from the 1994 census. These attributes include six numerical and seven categorical factors such as age, employment type, education, marital status, occupation, race, gender, capital gain, capital loss, weekly working hours, and native country. The primary task is to predict if an individual earns more than $50,000 annually. This dataset’s most commonly protected attributes are gender, age, and race.
Using the As Fairness Data widget, we will define “sex” as the protected attribute and “male” as the privileged, protected attribute value. Subsequently, we will employ the Dataset Bias widget to compute the fairness metrics and a Box Plot for visualization.

The results show that the dataset exhibits bias: the disparate impact is 0.358, and the statistical parity difference stands at -0.196. In an ideal scenario signifying no bias, these values would be 1 and 0, respectively. We can further visualize the dataset’s bias using the Box Plot.

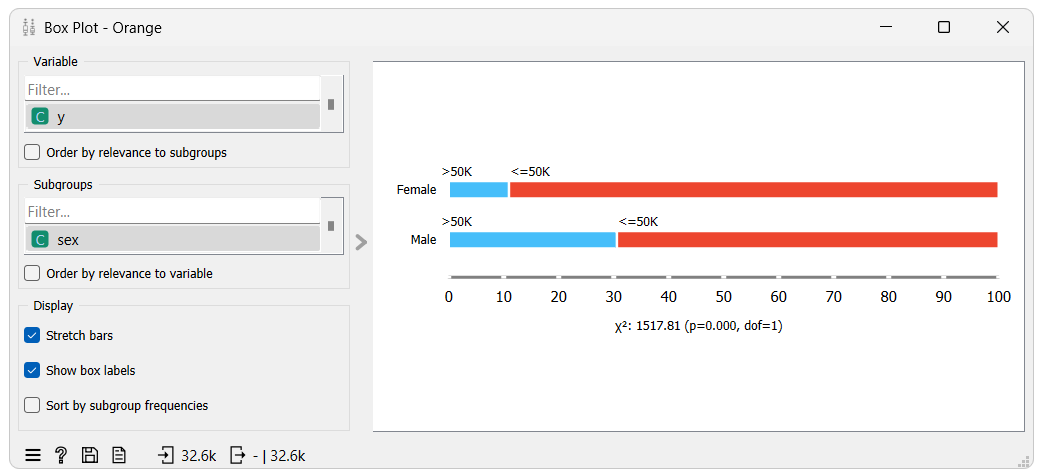
The Box Plot illustrates the distribution of the target variable across both privileged and unprivileged groups. Hovering over the plot reveals that only 10.95% of the females in the dataset belong to the favorable class, in contrast to the 30.57% of males. By dividing the percentage of the favorable class for the unprivileged group by that of the privileged group, we arrive at a disparate impact value of 0.358—precisely what the Dataset Bias widget determined. We can do a similar calculation for the statistical parity difference.
