The six videos explaining hierarchical clustering in Orange are a part of Introduction to Data Science series. We are preparing the videos for an online course aimed at students interested in data science. The course does not assume any background knowledge in math, statistics, and computer science and is, therefore, aimed at data science beginners. We are designing the course as a part of Explainable AI in Healthcare Management. A grant from European Union supports its creation.
The six videos cover the topics of
- computation of distances in two-dimensions,
- computation of distances between group of data instances,
- representing the results of clustering in the dendrogram,
- hierarchical clustering in higher dimensions,
- use of hierarchical clustering on socioeconomic data, and
- cluster explanation.
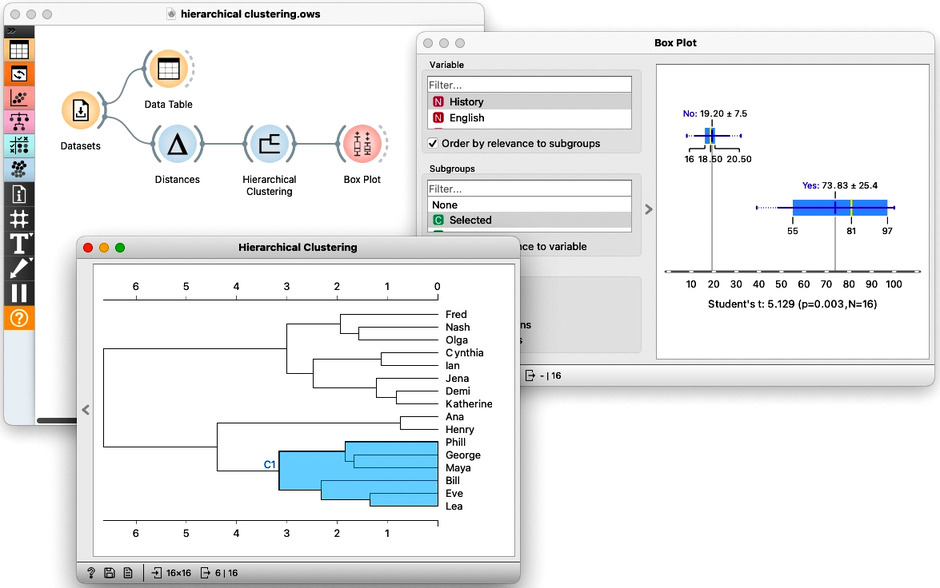
We use two data sets in these videos. One includes imaginary data on student grades. Our task is to find student clusters and understand the characteristics of the students in each group.

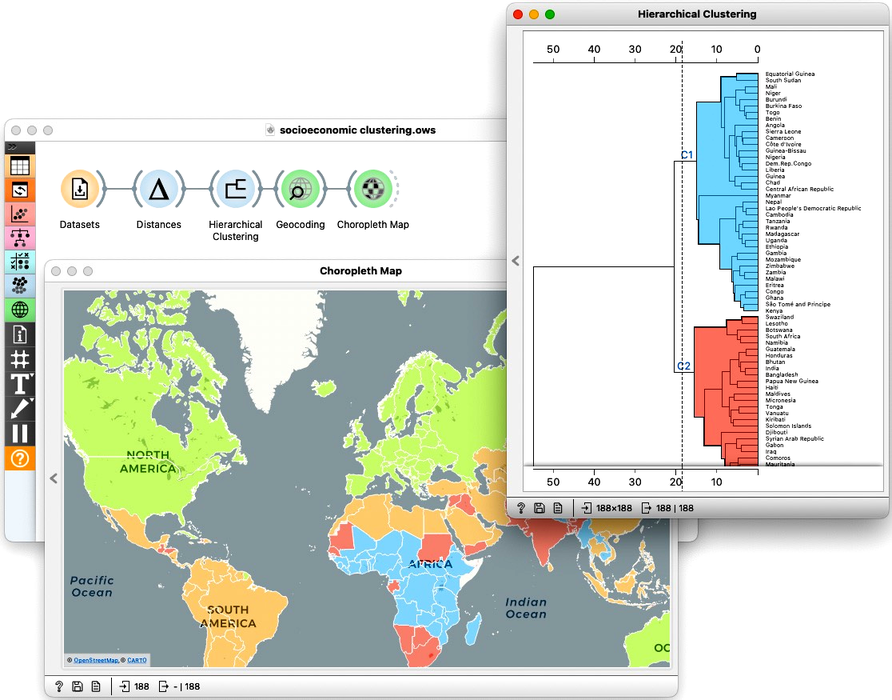
The second data set contains socioeconomic information on countries of the world. Here, we aimed to find clusters of countries with similar socioeconomic characteristics. It is interesting how easy it is to use Orange to find regions of comparable countries and how the world, despite its connectedness, is split and different.

