The Orange3 Network add-on contains a convenient Network Explorer widget for network visualization. Orange uses an iterative force-directed method (a variation of the Fruchterman-Reingold Algorithm) to layout the nodes on the 2D plane.

The goal of force-directed methods is to draw connected nodes close to each other as if the edges that connect the nodes were acting as springs. We also don’t want all nodes crowded in a single point, but would rather have them spaced evenly. This is achieved by simulating a repulsive force, which decreases with the distance between nodes.
There are two types of forces acting on each node:
- the attractive force towards connected adjacent nodes,
- the repulsive force that is directed away from all other nodes.
We could say that such network visualization as a whole is rather repulsive. Let’s take for example the lastfm.net network that comes with Orange’s network add-on and which has around 1.000 nodes and 4.000 edges. In every iteration, we have to consider 4.000 attractive forces and 1.000.000 repulsive forces for every of 1.000 times 1.000 edges. It takes about 100 iterations to get a decent network layout. That’s a lot of repulsions, and you’ll have to wait a while before you get the final layout.
Fortunately, we found a simple hack to speed things up. When computing the repulsive force acting on some node, we only consider a 10% sample of other nodes to obtain an estimate. We multiply the result by 10 and hope it’s not off by too much. By choosing a different sample in every iteration we also avoid favoring some set of nodes.
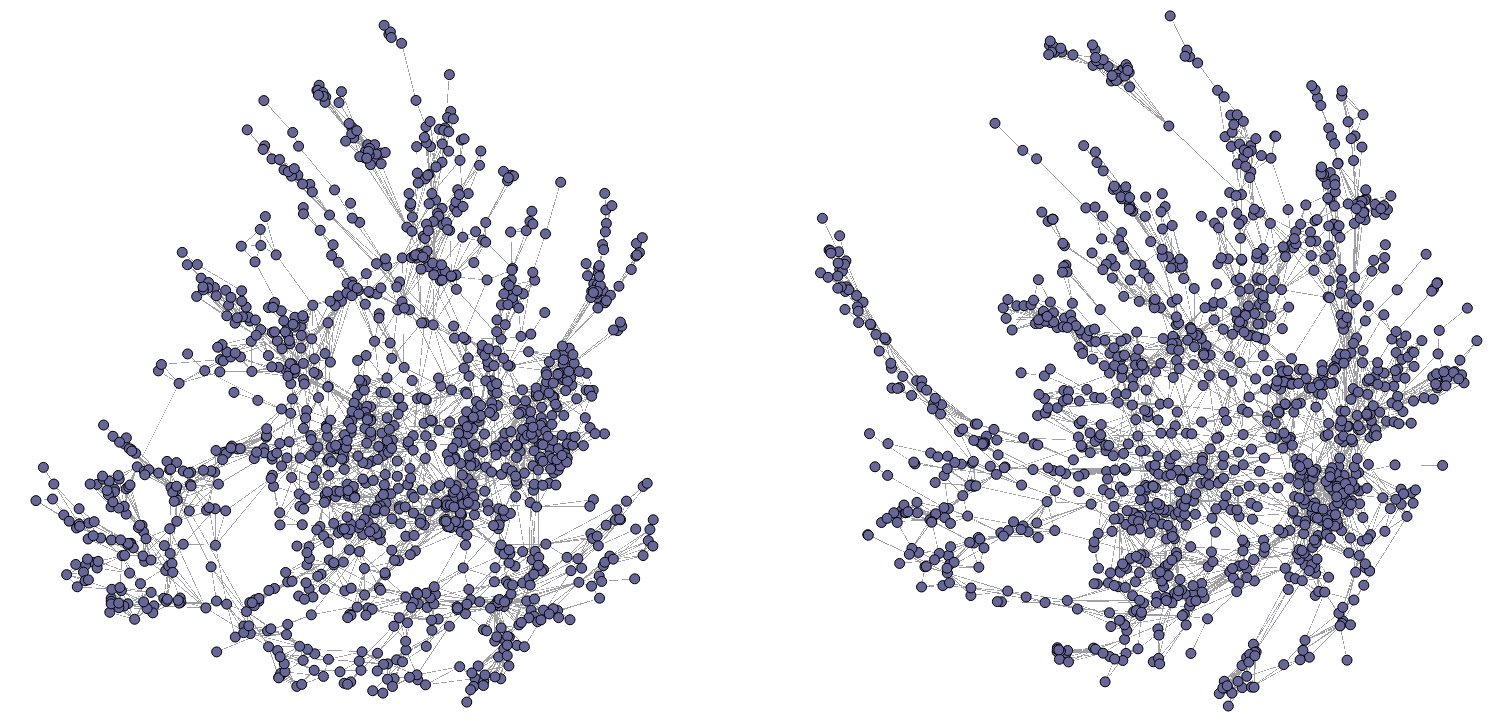
The left layout is obtained without sampling while the right one uses a 10% sampling. The results are pretty similar, but the sampling method is 10 times faster!

Now that the computation is fast enough, it is time to also speed-up the drawing. But that’s a task for 2018.
