On Monday we finished the second part of the workshop for the Statistical Office of Republic of Slovenia. The crowd was tough - these guys knew their numbers and asked many challenging questions. And we loved it!

One thing we discussed was how to properly test your model. Ok, we know never to test on the same data you’ve built your model with, but even training and testing on separate data is sometimes not enough. Say I’ve tested Naive Bayes, Logistic Regression and Tree. Sure, I can select the one that gives the best performance, but we could potentially (over)fit our model, too.
To account for this, we would normally split the data to 3 parts:
- training data for building a model
- validation data for testing which parameters and which model to use
- test data for estmating the accurracy of the model
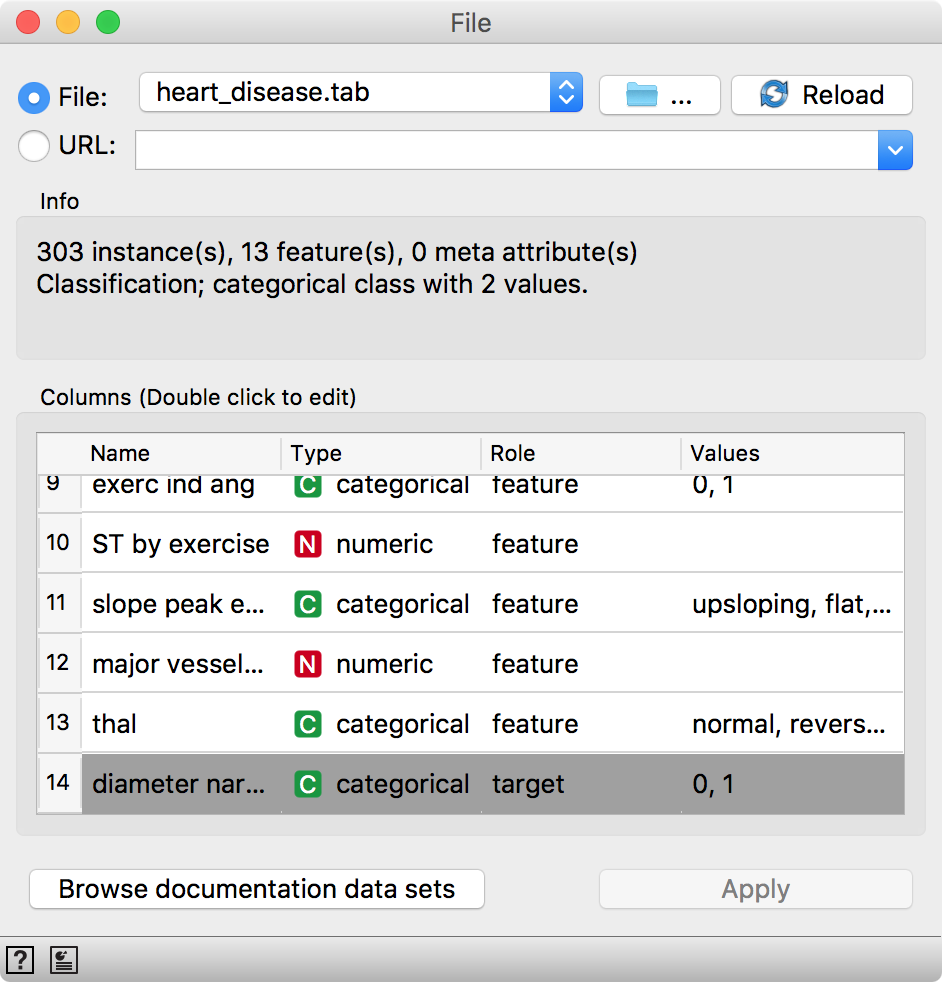
Let us try this in Orange. Load heart-disease.tab data set from Browse documentation data sets in File widget. We have 303 patients diagnosed with blood vessel narrowing (1) or diagnosed as healthy (0).
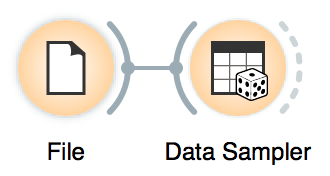
Now, we will split the data into two parts, 85% of data for training and 15% for testing. We will send the first 85% onwards to build a model.
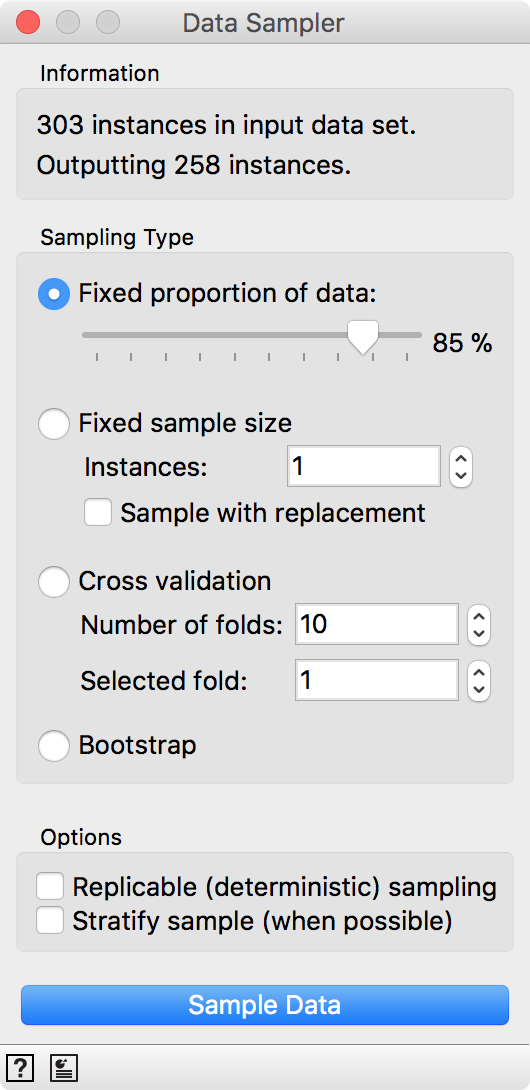 We sampled by a fixed proportion of data and went with 85%, which is 258 out of 303 patients.
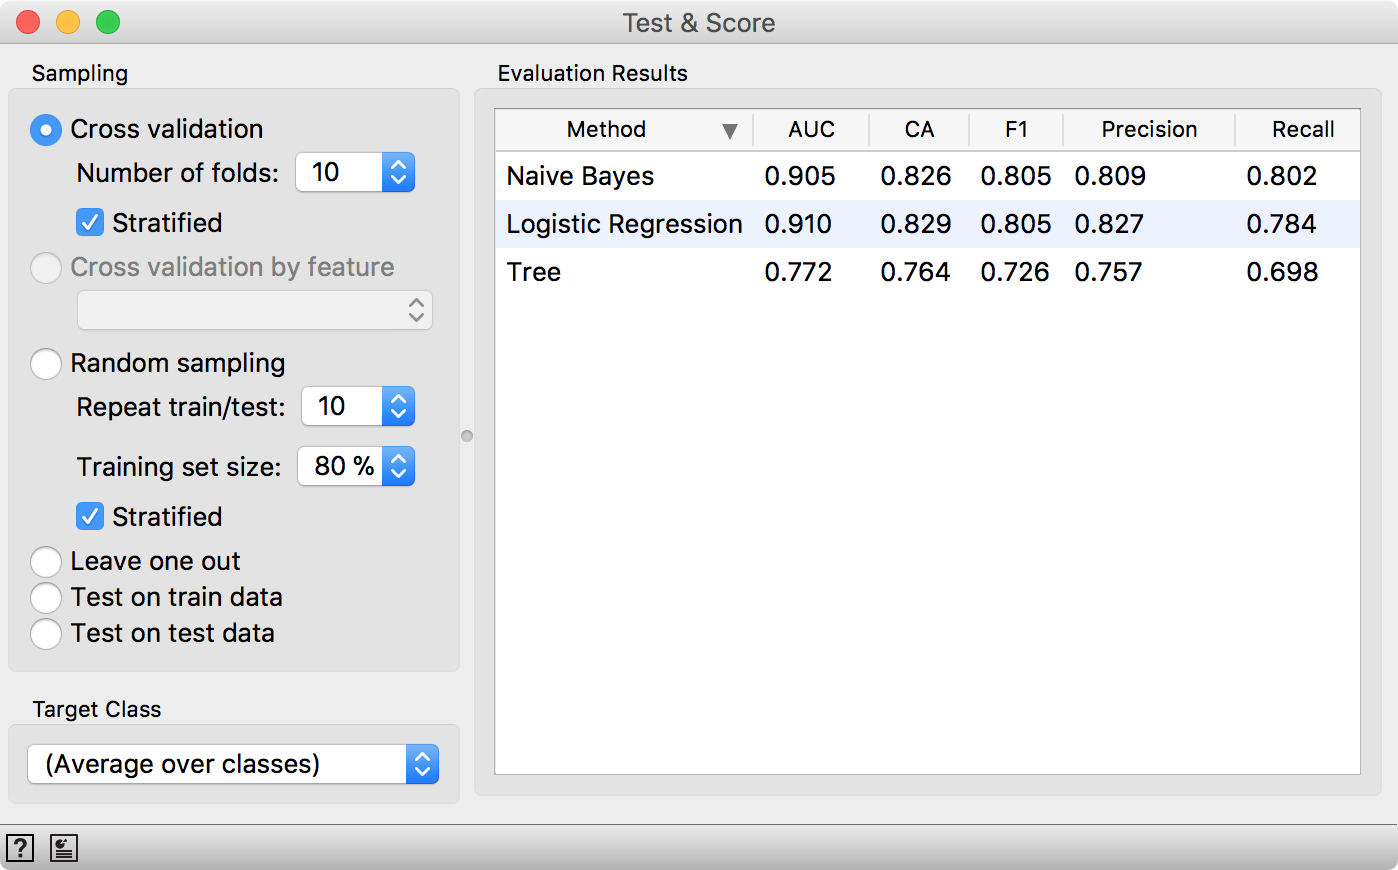
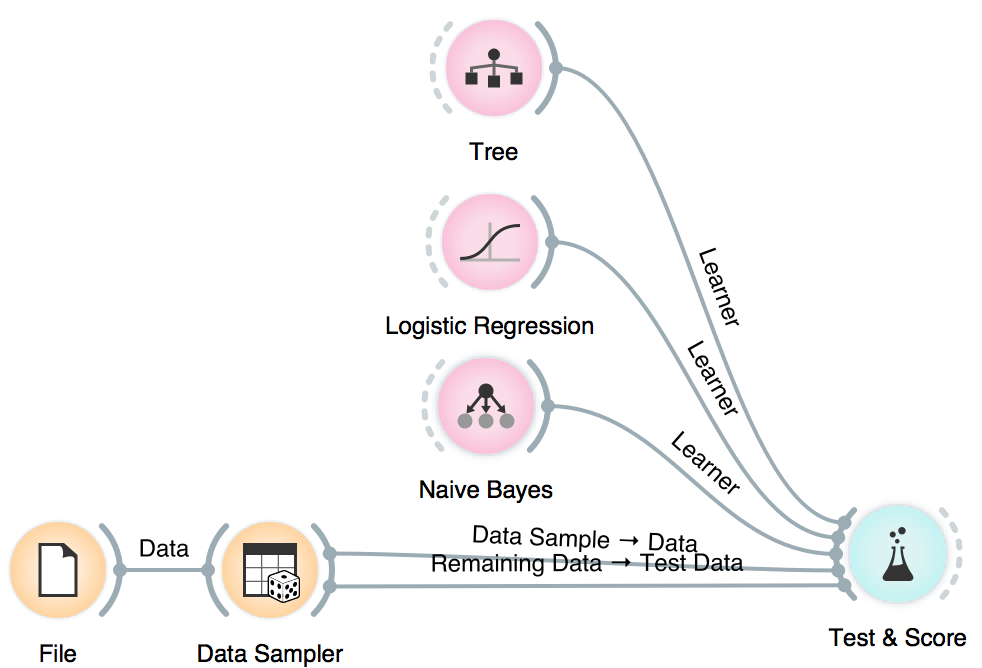
We will use Naive Bayes, Logistic Regression and Tree, but you can try other models, too. This is also a place and time to try different parameters. Now we will send the models to Test & Score. We used cross-validation and discovered Logistic Regression scores the highest AUC. Say this is the model and parameters we want to go with.
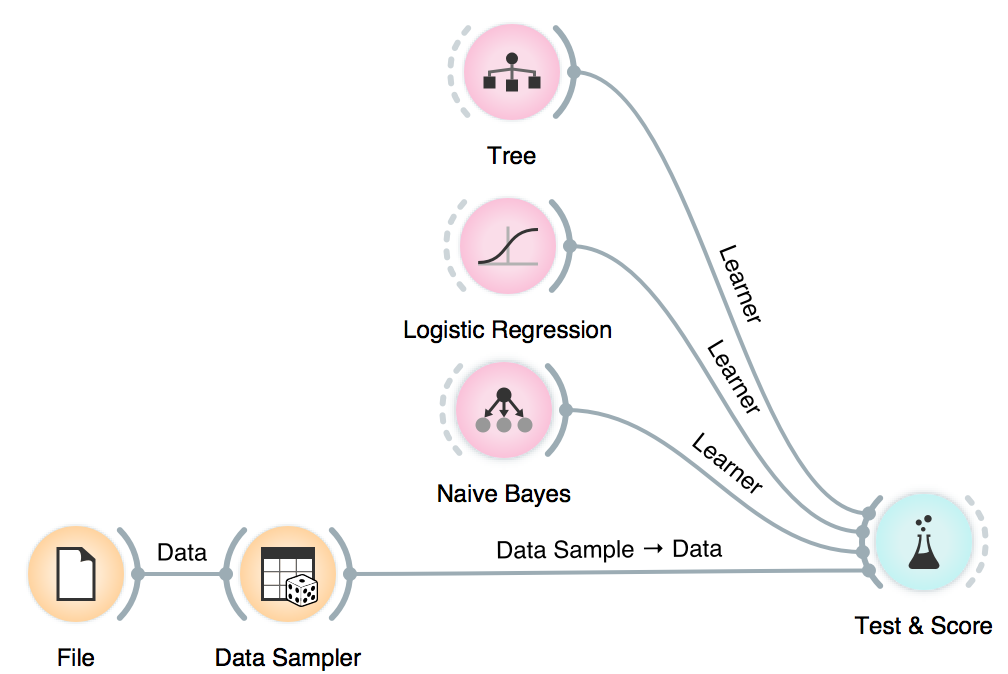
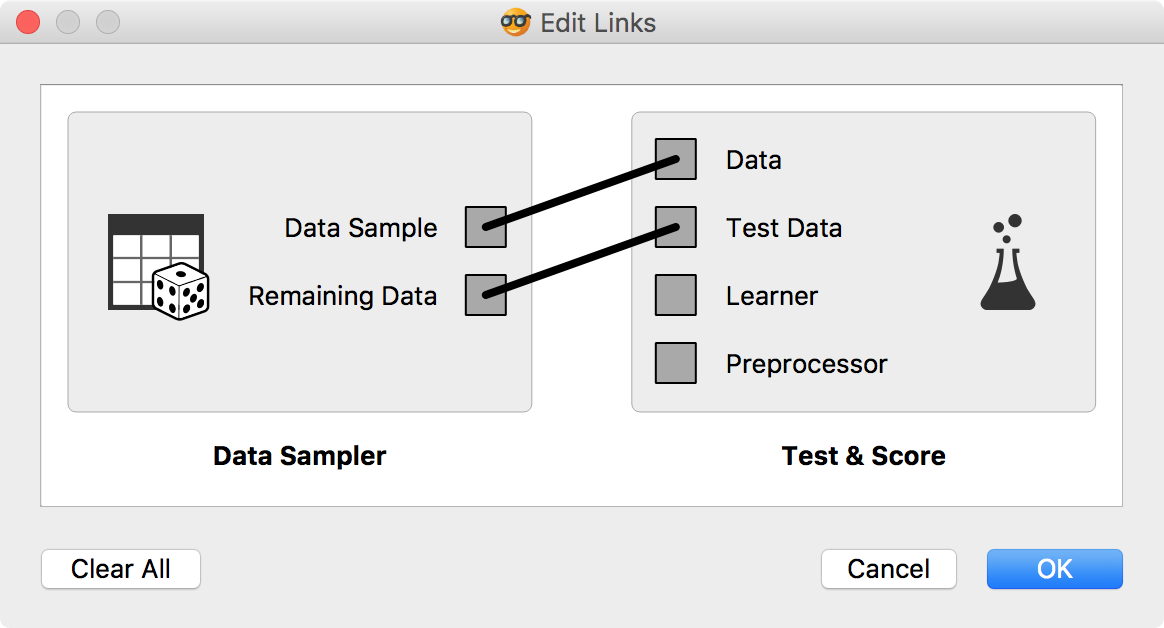
Now it is time to bring in our test data (the remaining 15%) for testing. Connect Data Sampler to Test & Score once again and set the connection Remaining Data - Test Data.
Test & Score will warn us we have test data present, but unused. Select Test on test data option and observe the results. These are now the proper scores for our models.
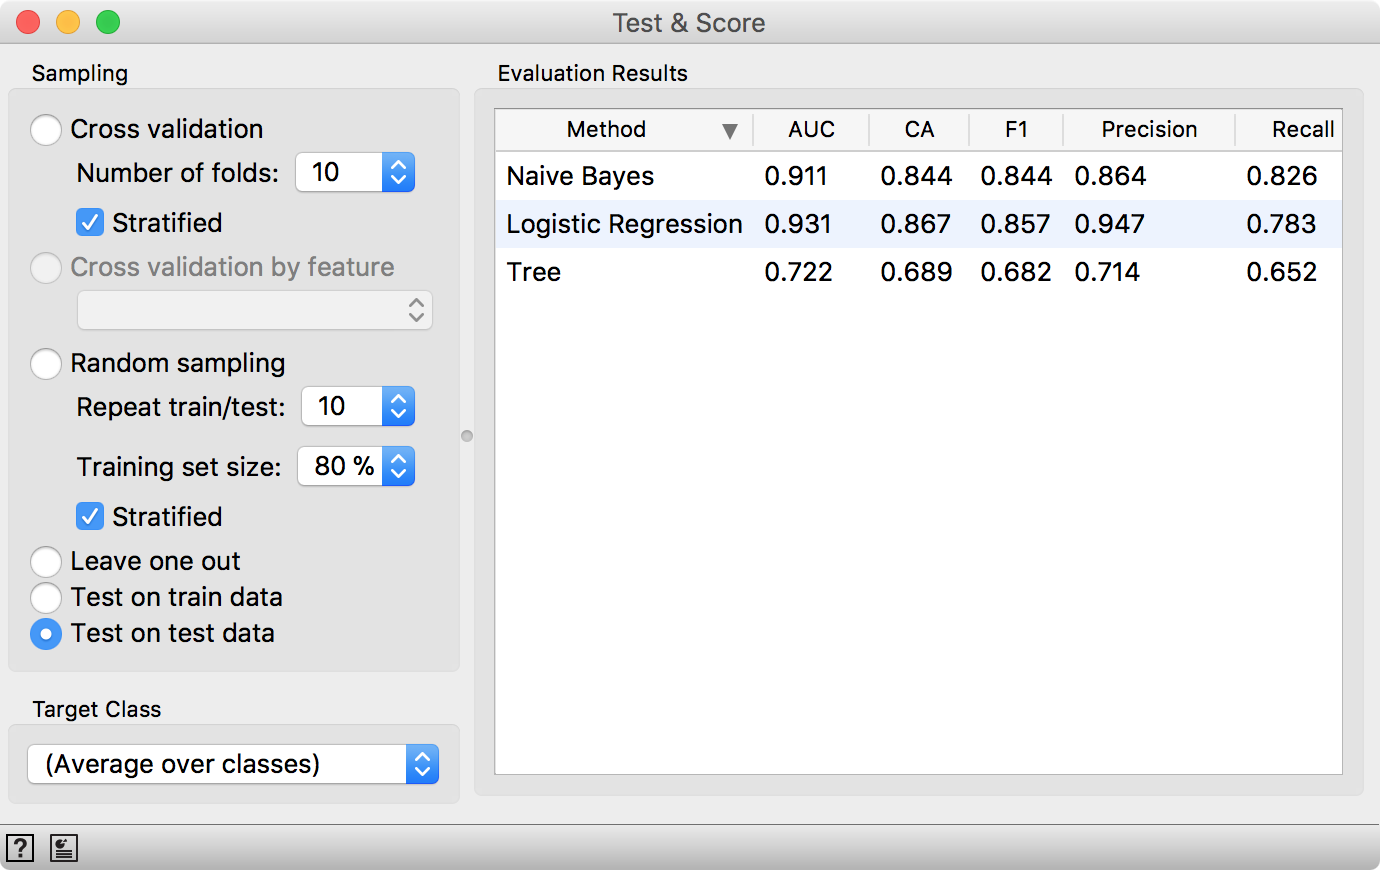
Seems like LogReg still performs well. Such procedure would normally be useful when testing a lot of models with different parameters (say +100), which you would not normally do in Orange. But it’s good to know how to do the scoring properly. Now we’re off to report on the results in Nature… ;)
