We have just completed the hands-on course on data science at one the most famous Indian educational institutions, Indian Statistical Institute. A one week course was invited by Institute’s director Prof. Dr. Sanghamitra Bandyopadhyay, and financially supported by the founding of India’s Global Initiative of Academic Networks.

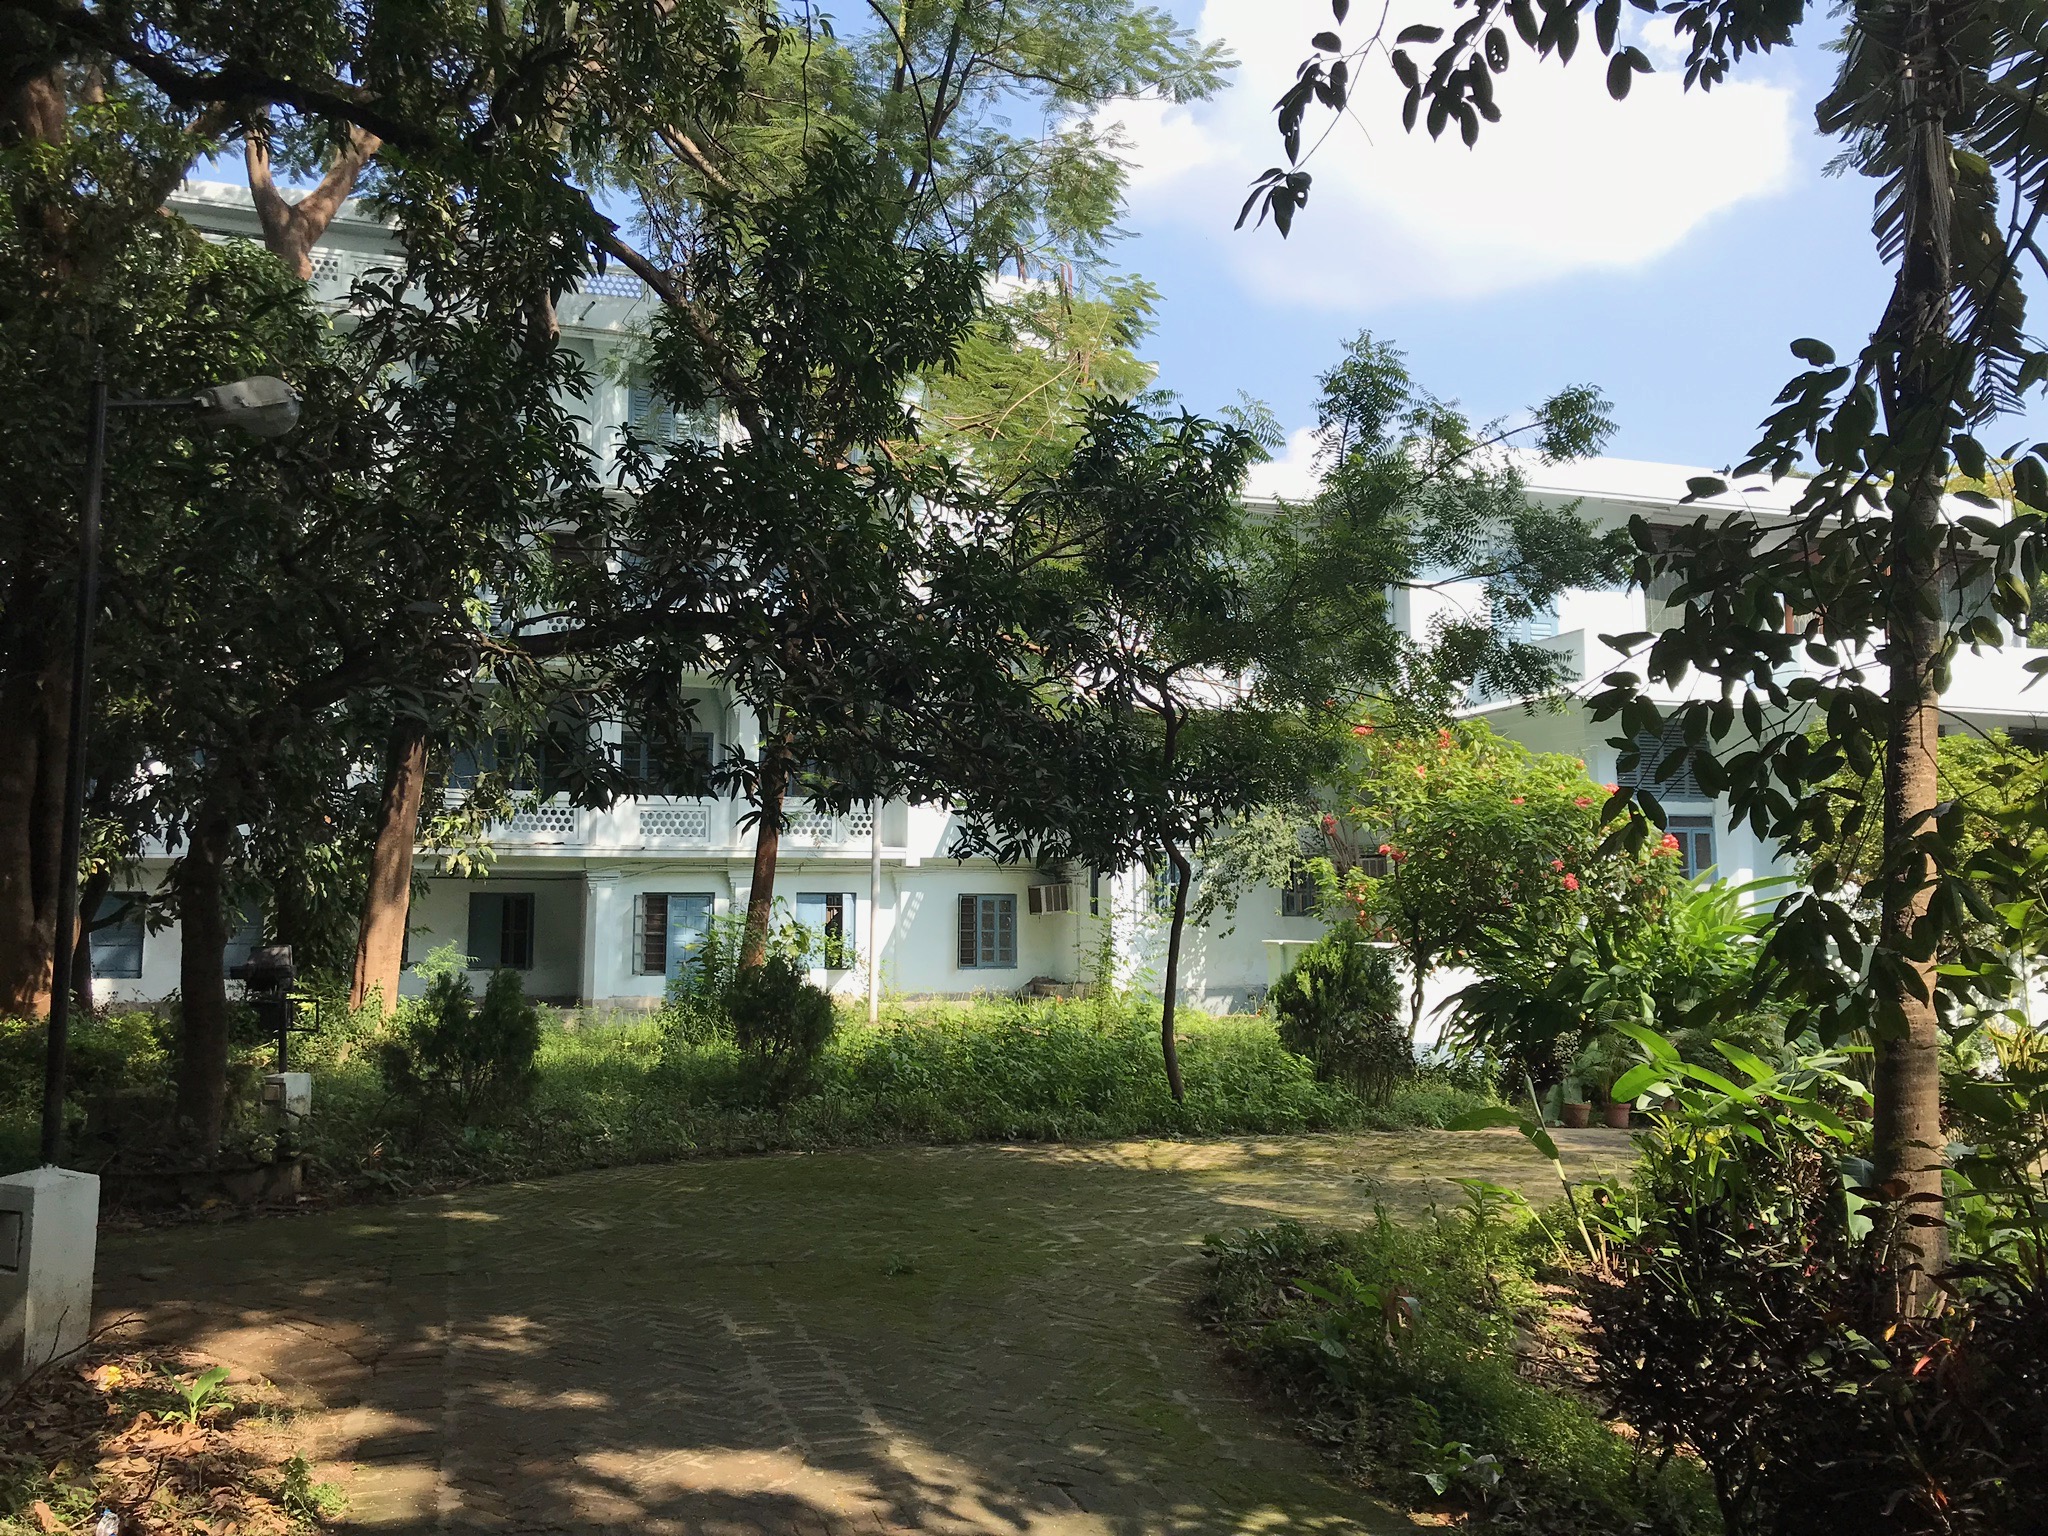
Indian Statistical Institute lies in the hearth of old Kolkata. A peaceful oasis of picturesque campus with mango orchards and waterlily lakes was founded by Prof. Prasanta Chandra Mahalanobis, one of the giants of statistics. Today, the Institute researches statistics and computational approaches to data analysis and runs a grad school, where a rather small number of students are hand-picked from tens of thousands of applicants.
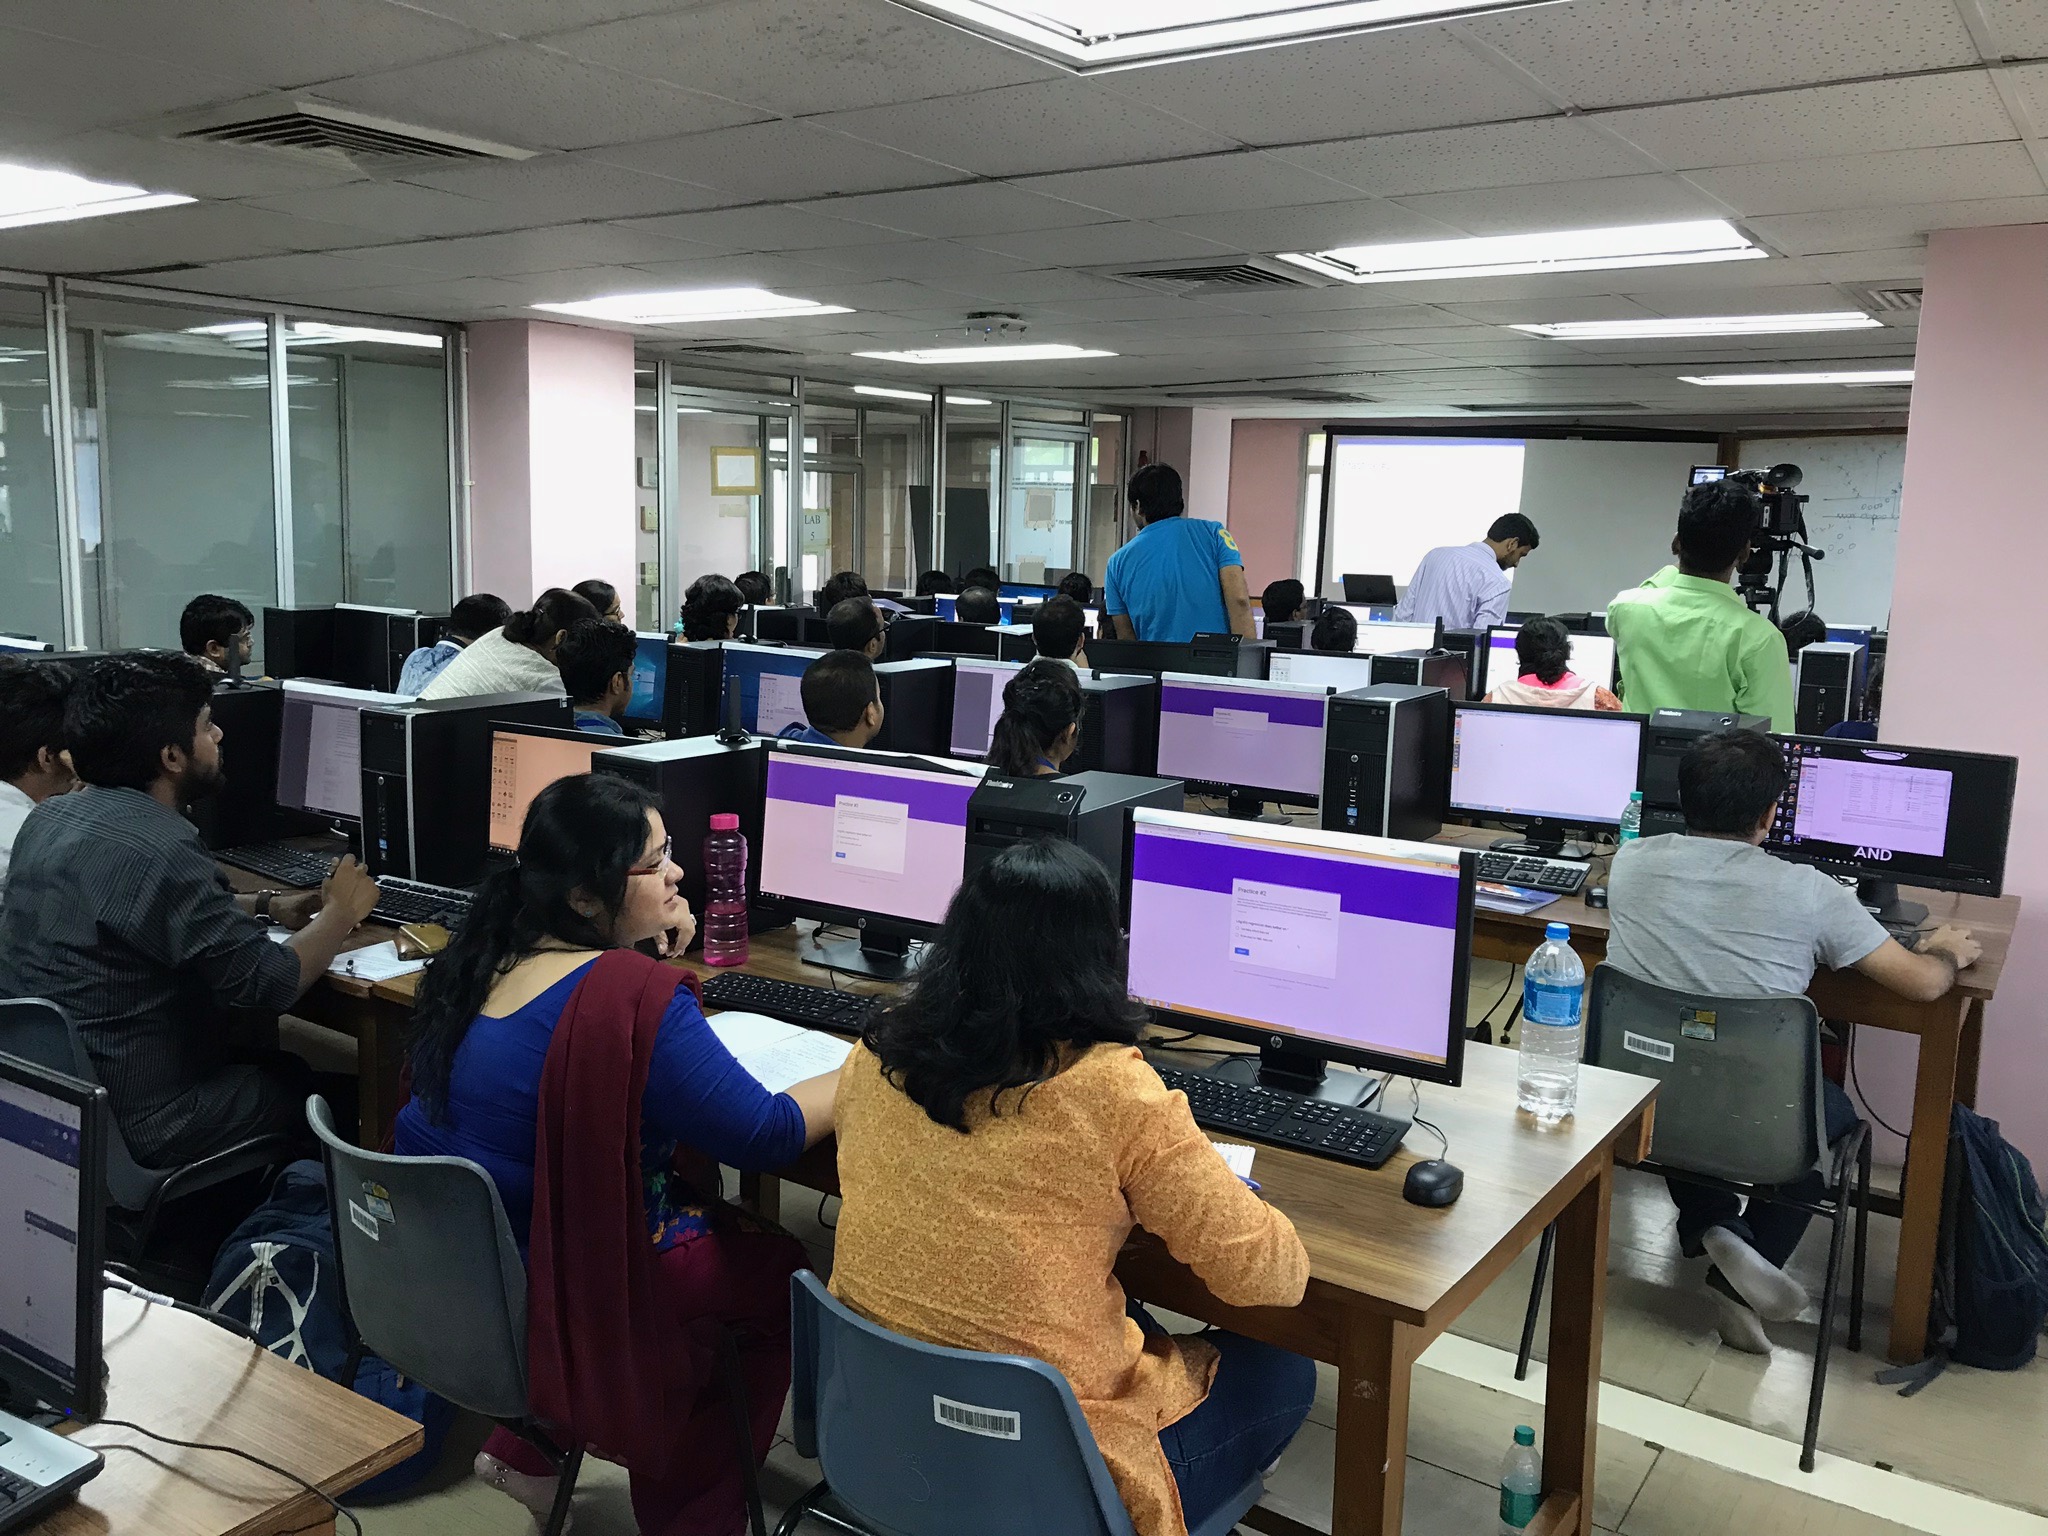
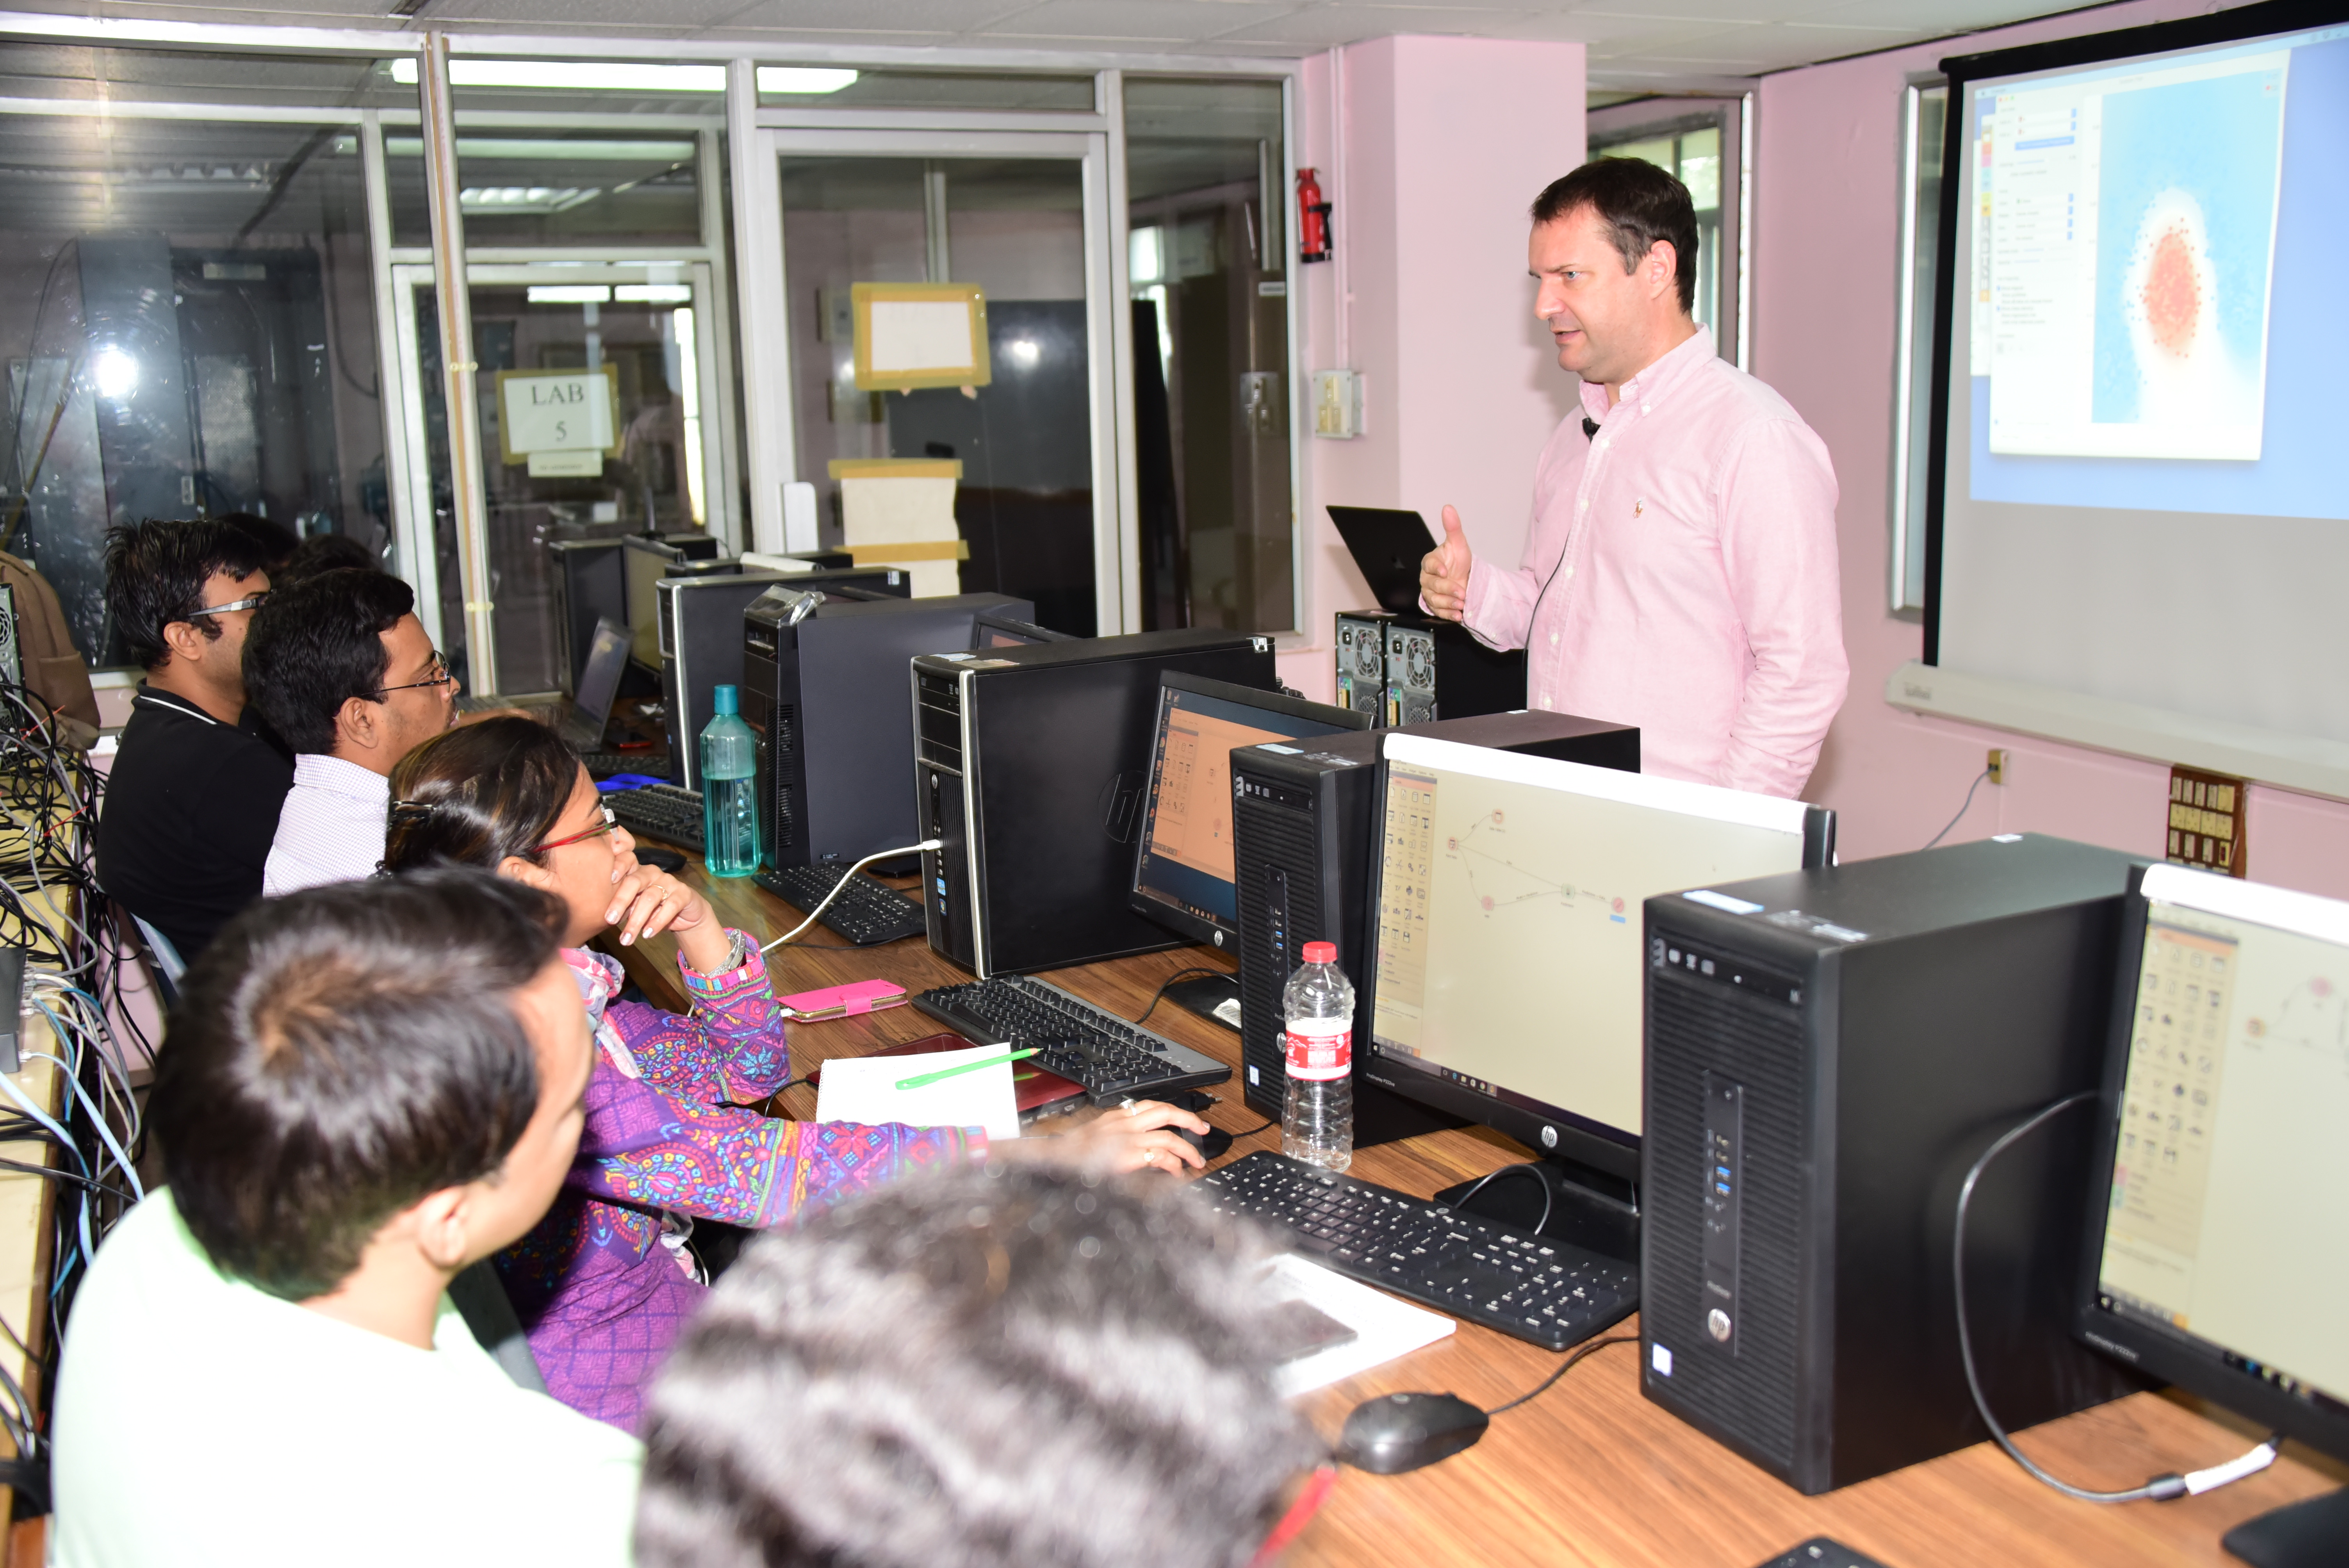
The course was hands-on. The number of participants was limited to forty, the limitation posed by the number of the computers in Institute’s largest computer lab. Half of the students came from Institute’s grad school, and another half from other universities around Kolkata or even other schools around India, including a few participants from another famous institution, India Institutes of Technology. While the lecture included some writing on the white-board to explain machine learning, the majority of the course was about exploring example data sets, building workflows for data analysis, and using Orange on practical cases.

The course was not one of the lightest for the lecturer (Blaž Zupan). About five full hours each day for five days in a row, extremely motivated students with questions filling all of the coffee breaks, the need for deeper dive into some of the methods after questions in the classroom, and much need for improvisation to adapt our standard data science course to possibly the brightest pack of data science students we have seen so far. We have covered almost a full spectrum of data science topics: from data visualization to supervised learning (classification and regression, regularization), model exploration and estimation of quality. Plus computation of distances, unsupervised learning, outlier detection, data projection, and methods for parameter estimation. We have applied these to data from health care, business (which proposal on Kickstarter will succeed?), and images. Again, just like in our other data science courses, the use of Orange’s educational widgets, such as Paint Data, Interactive k-Means, and Polynomial Regression helped us in intuitive understanding of the machine learning techniques.

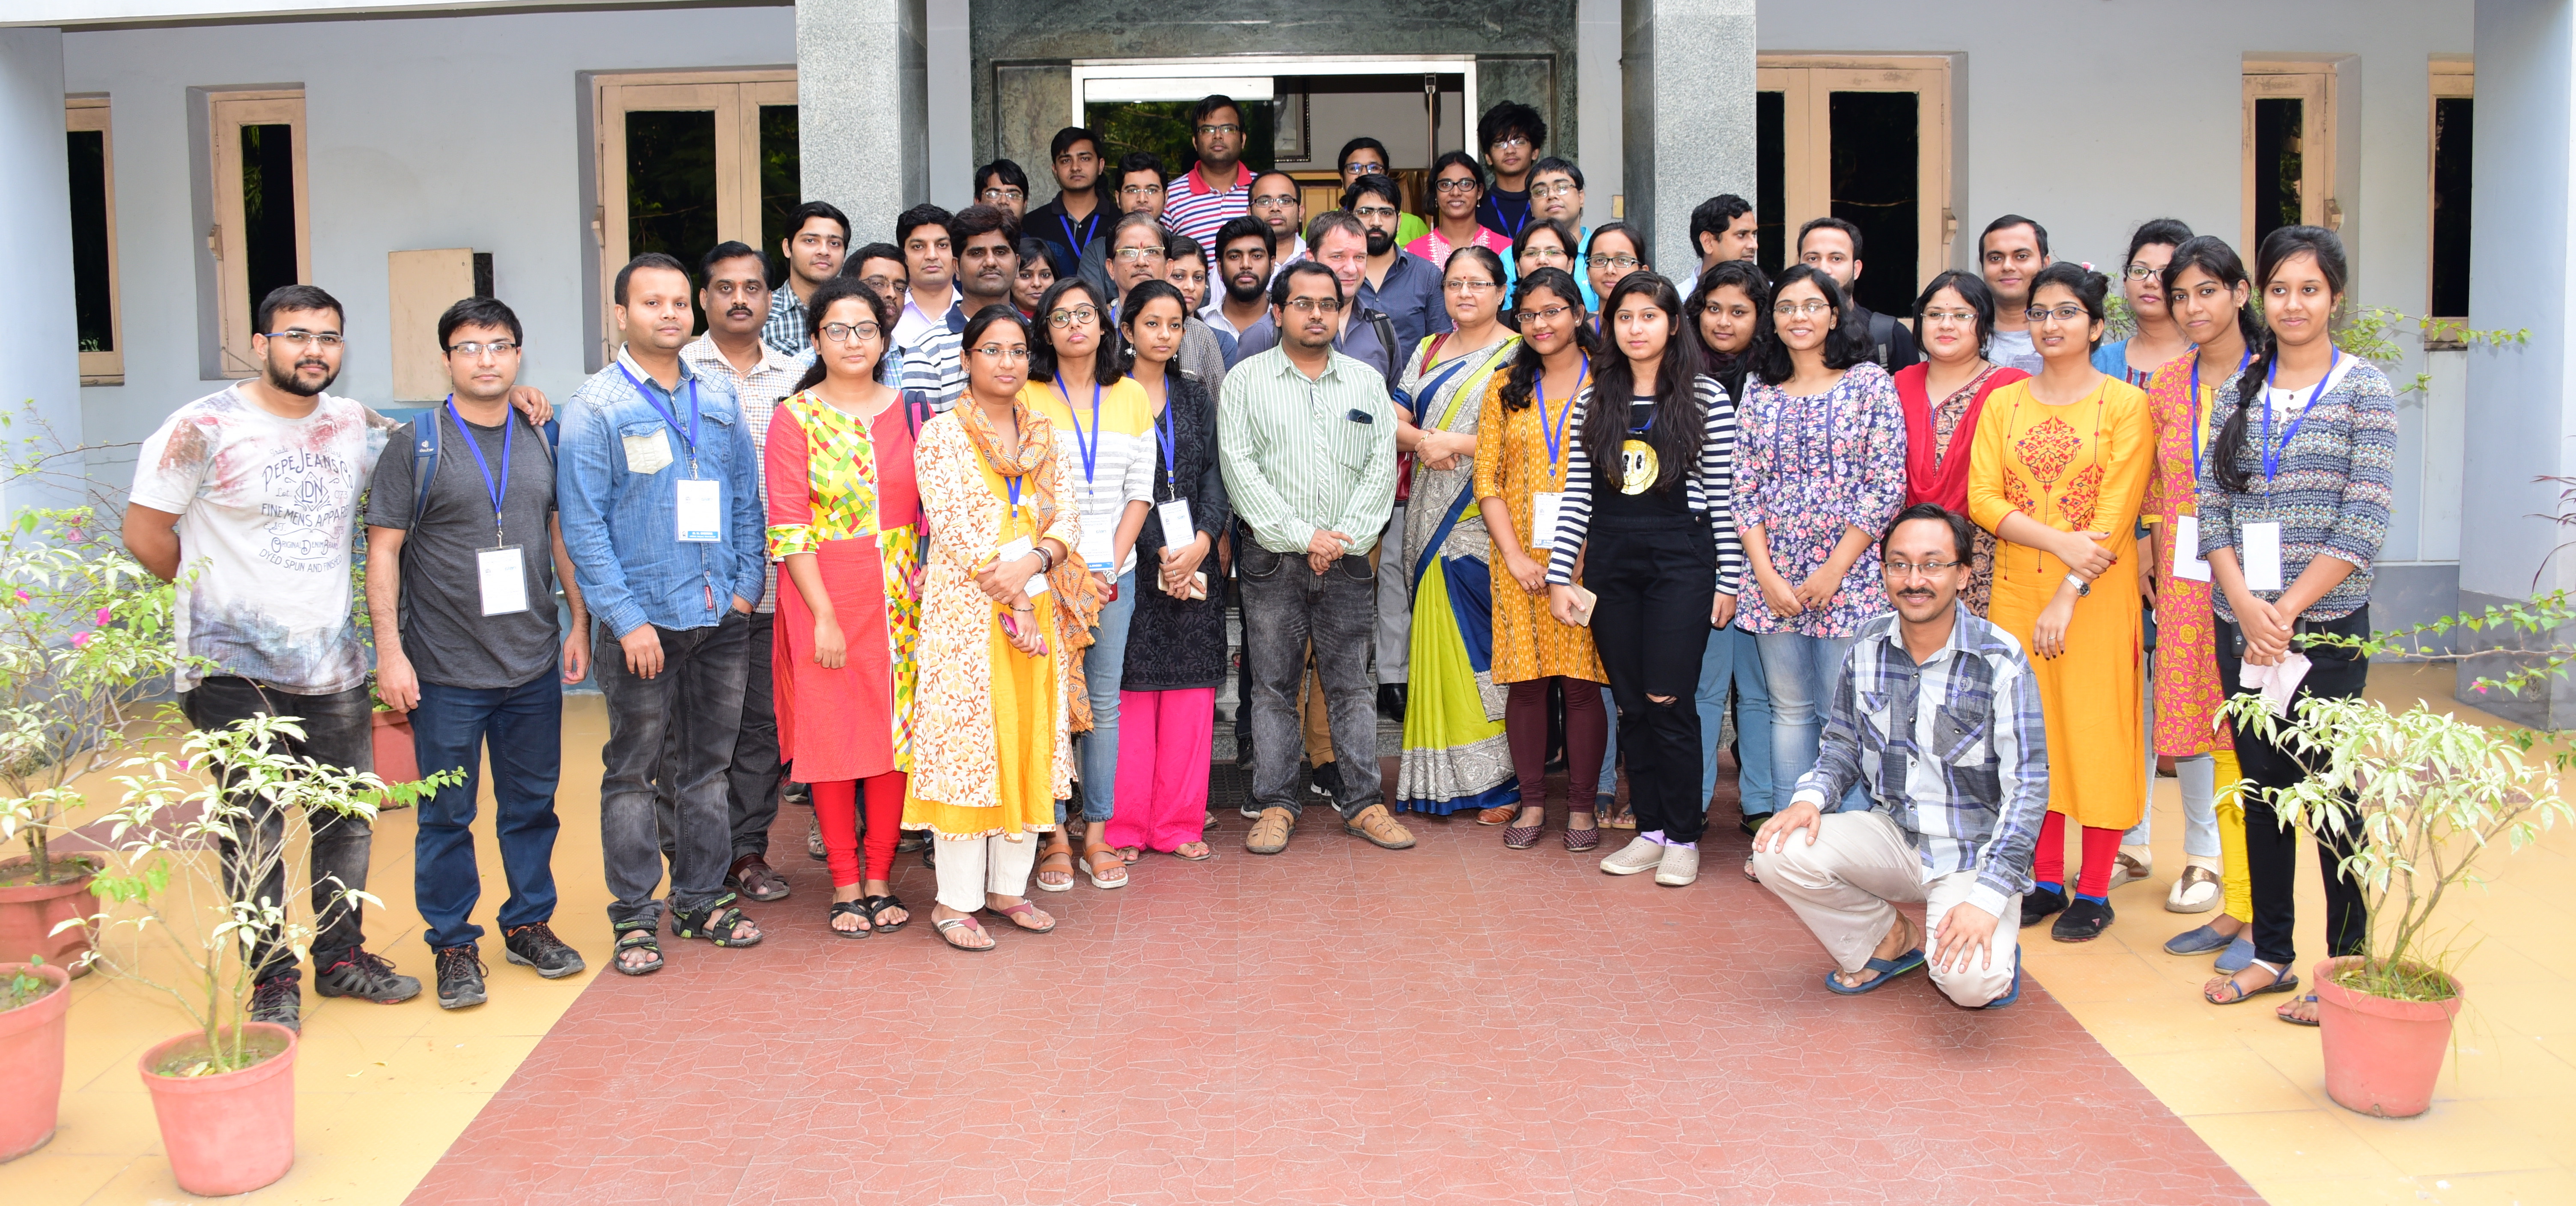
The course was beautifully organized by Prof. Dr. Saurabh Das with the help of Prof. Dr. Shubhra Sankar Ray and we would like to thank them for their devotion and excellent organization skills. And of course, many thanks to participating students: for an educator, it is always a great pleasure to lecture and work with highly motivated and curious colleagues that made our trip to Kolkata fruitful and fun.

