One day Blaž and Janez came to us and started complaining how slow Orange download is in the US. Since they hold a large course at Baylor College of Medicine every year, this causes some frustration.
Related: Introduction to Data Mining Course in Houston
But we have the data and we’ve promptly tried to confirm their complaints by analyzing them… well, in Orange!
First, let us observe the data. We have 4887 recorded download sessions with one meta feature reporting on the country of the download and four features with time, size, speed in bytes and speed in gigabytes of the download.
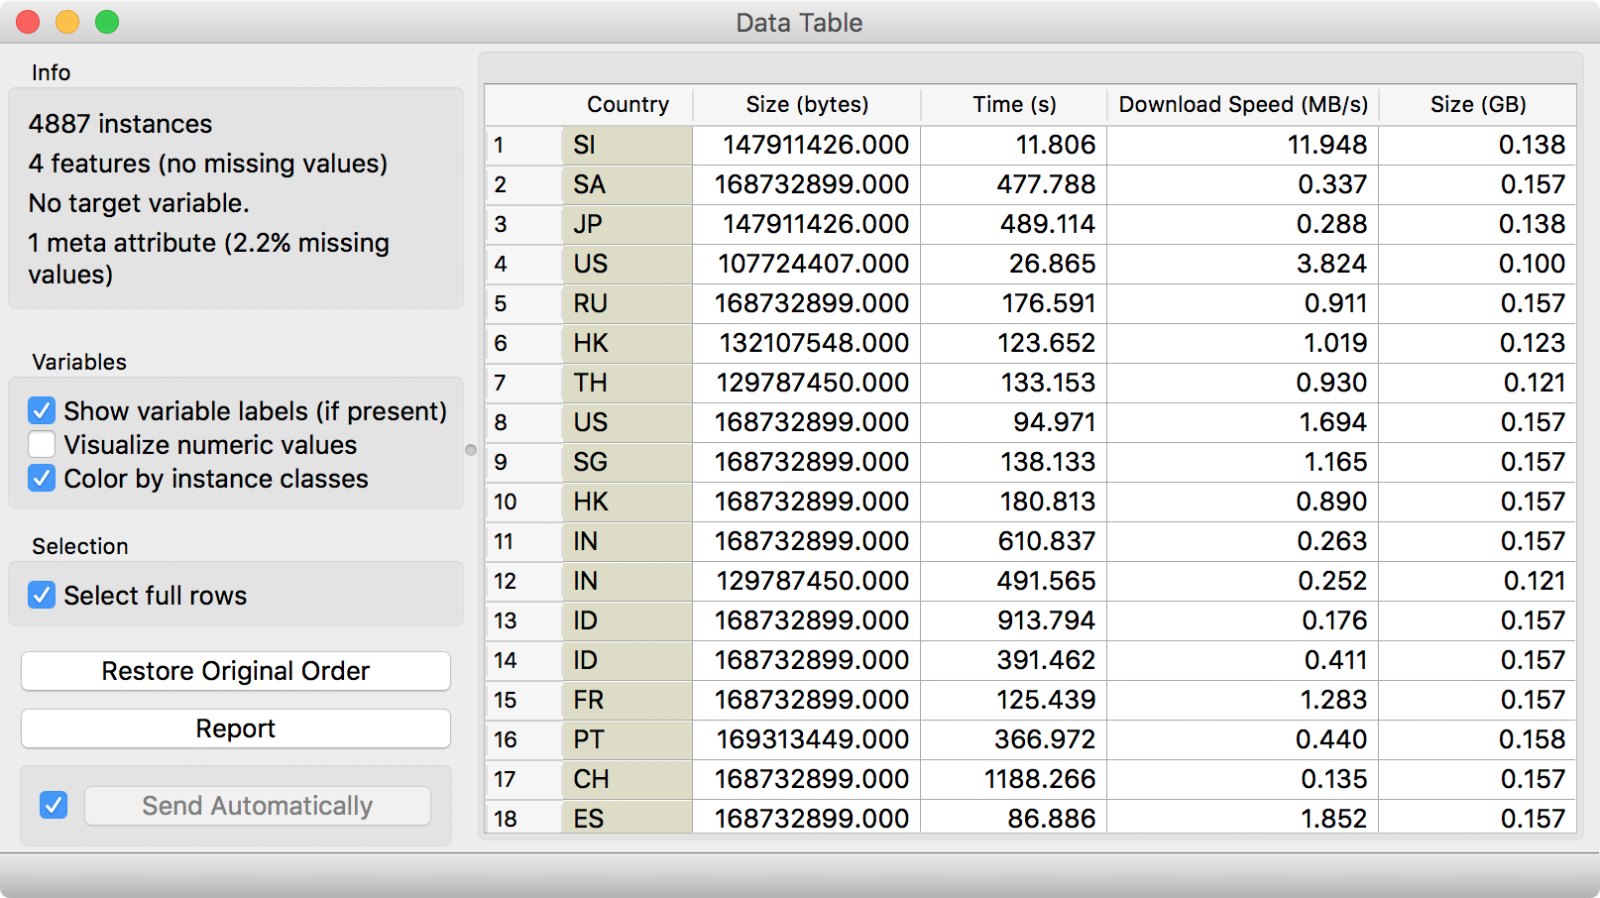
Data of Orange download statistics. We get reports on the country of download, the size and the time of the download. We have constructed speed and size in gigabytes ourselves with simple formulae.
Now let us check the validity of Blaž’s and Janez’s complaint. We will use orange3-geo add-on for plotting geolocated data. For any geoplotting, we need coordinates - latitude and longitude. To retrieve them automatically, we will use Geocoding widget.
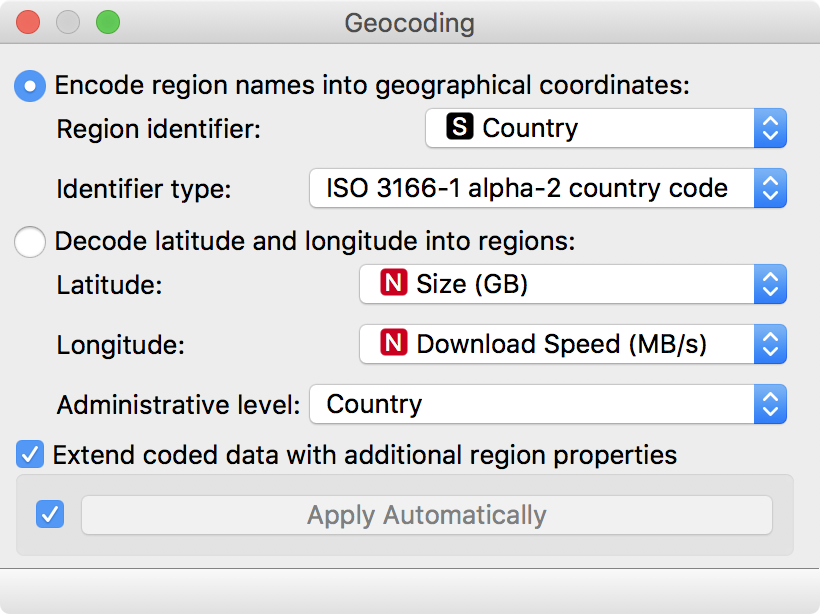
We instruct Geocoding to retrieve coordinates from our Country feature. Identifier type tells the widget in what format the region name appears.
We told the widget to use the ISO-compliant country code from Country attribute and encode it into coordinates. If we check the new data in a Data Table, we see our data is enhanced with new features.
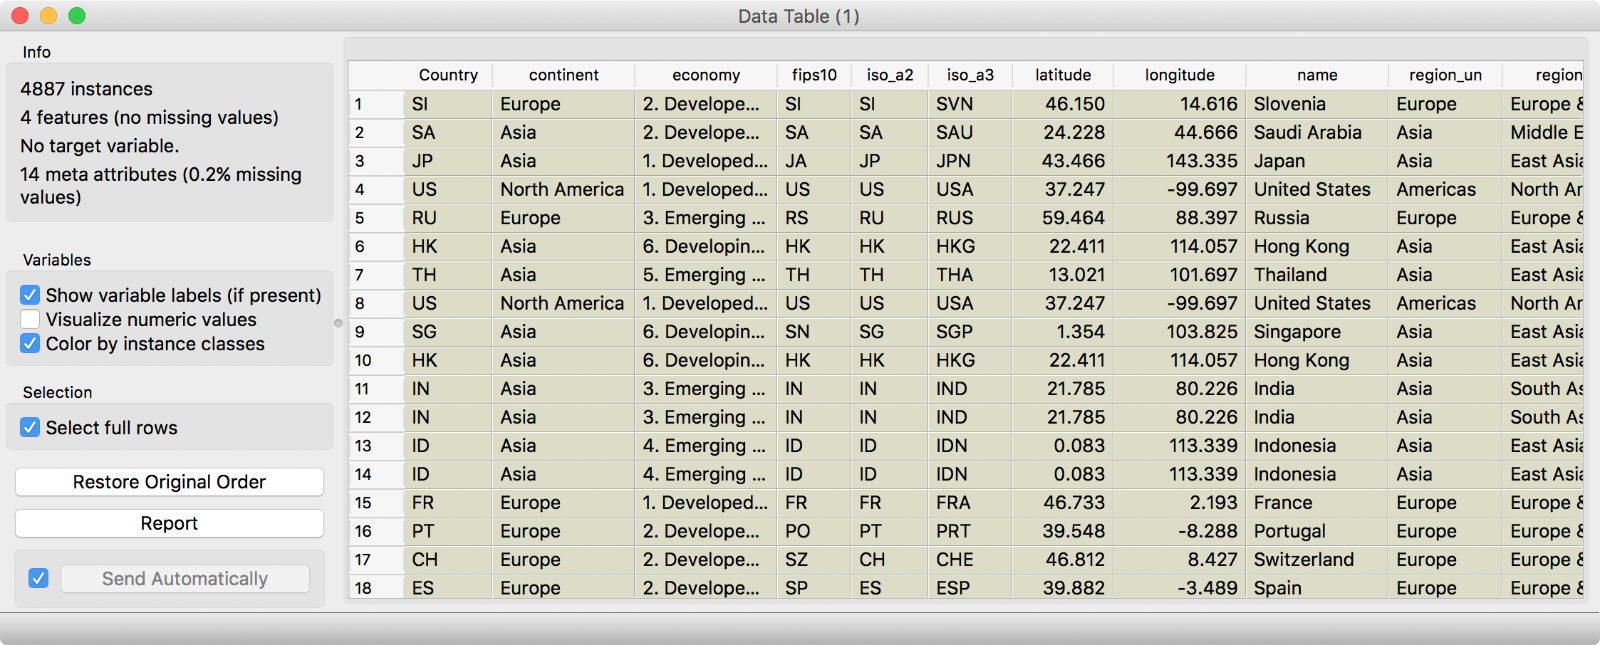 Enhanced data table. Besides latitude and longitude, Geocoding can also append country-level data (economy, continent, region…).
Now that we have coordinates, we can plot these data regionally - in Choropleth widget! This widget plots data on three levels - country, state/region and county/municipality. Levels correspond to the administrative division of each country.
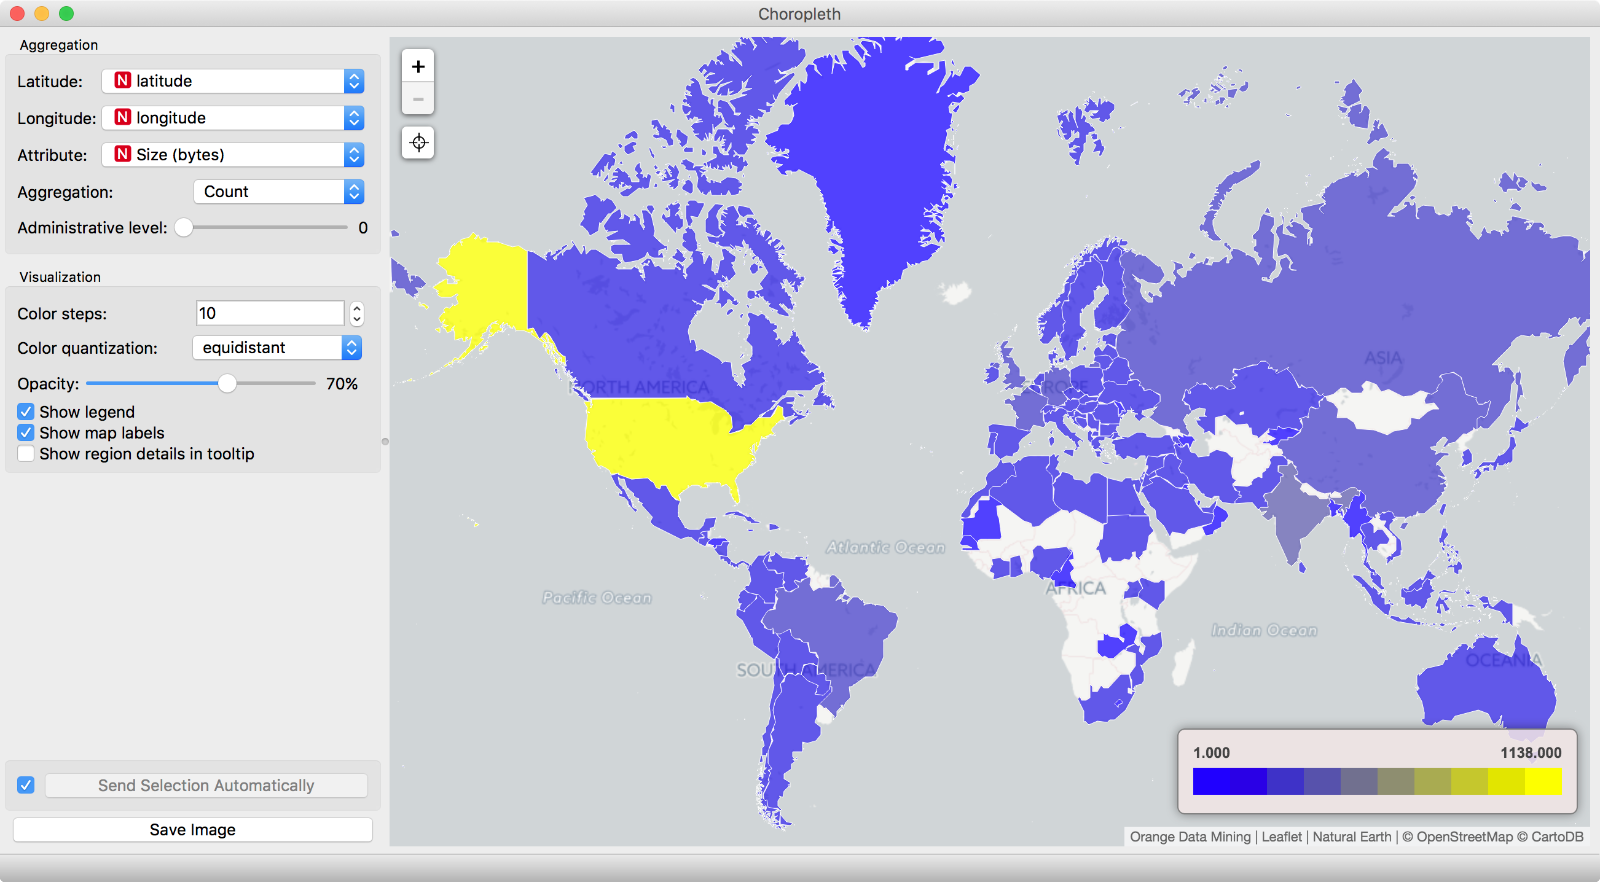
Choropleth widget offers 3 aggregation levels. We chose country (e.g. administrative level 0), but with a more detailed data one could also plot by state/county/municipality. Administrative levels are different for each country (e.g. Bundesländer for Germany, states for the US, provinces for Canada…).
In the plot above, we have simply displayed the amount of people (Count) that downloaded Orange in the past couple of months. Seems like we indeed have most users in the US, so it might make sense to solve installation issues for this region first.
Now let us check the speed of the download - it is really so slow in the US? If we take the mean, we can see that Slovenia is far ahead of the rest as far as download speed is concerned. No wonder - we are downloading via the local network. Scandinavia, Central Europe and a part of the Balkans seem to do quite ok as well.
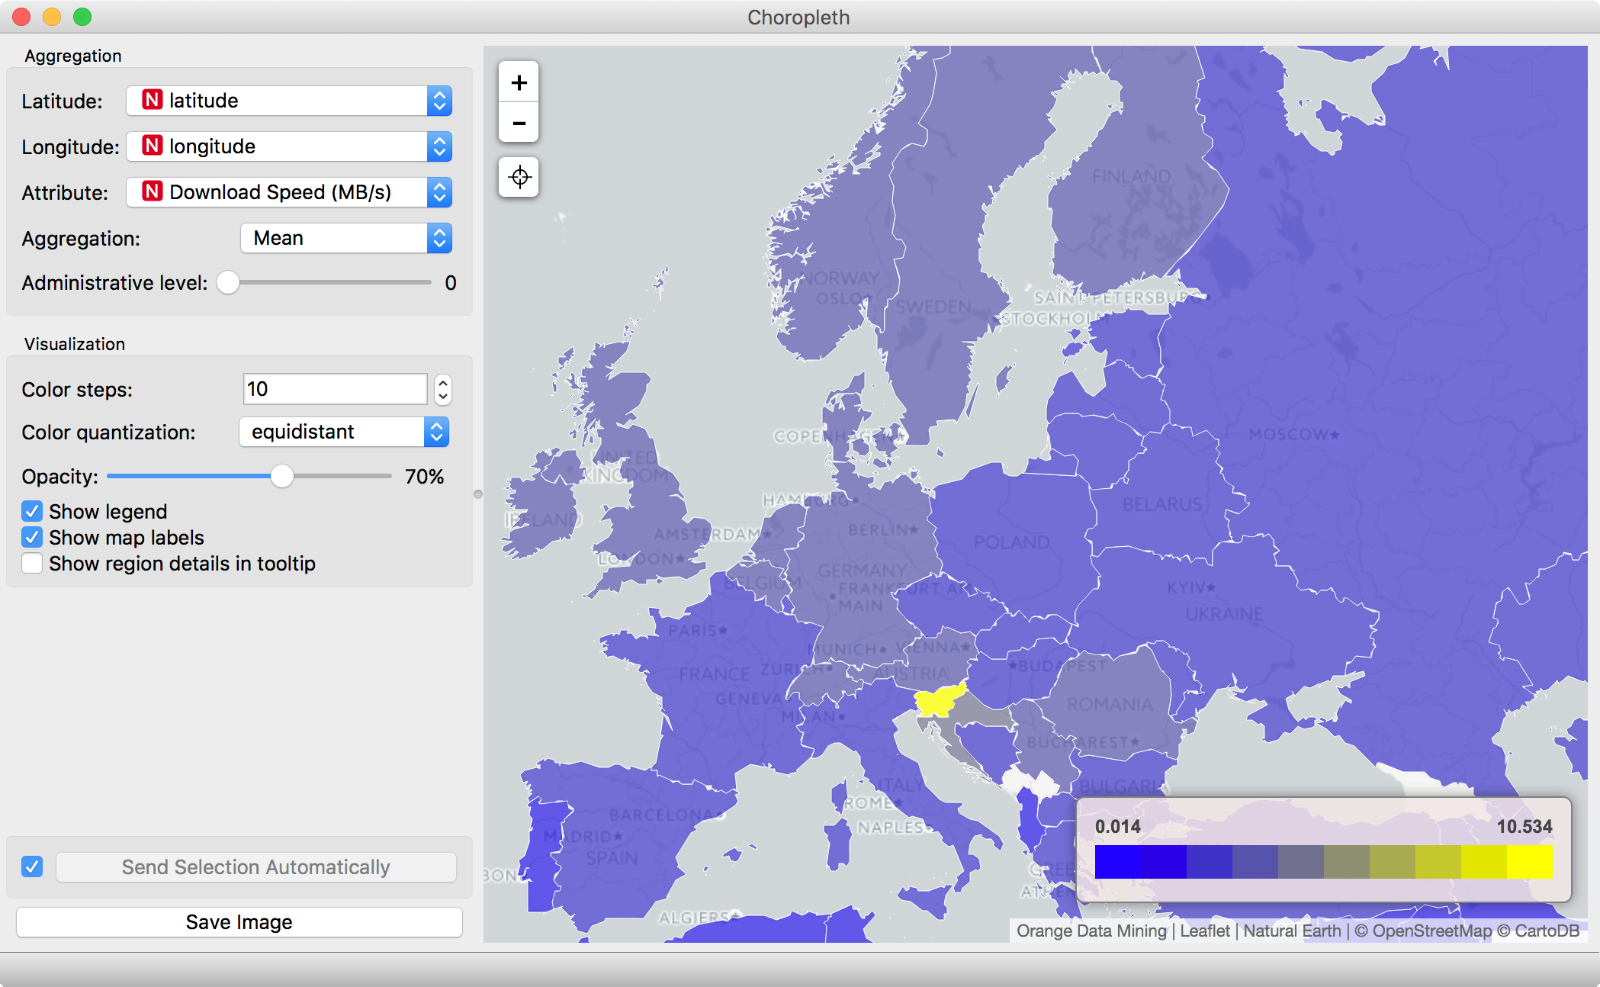
Aggregation by mean.
But mean sometimes doesn’t show the right picture - it is sensitive to outliers, which would be the case of Slovenia here. Let us try median instead. Looks like 50% of American download at speed lower than 1.5MB/s. Quite average, but it could be better.
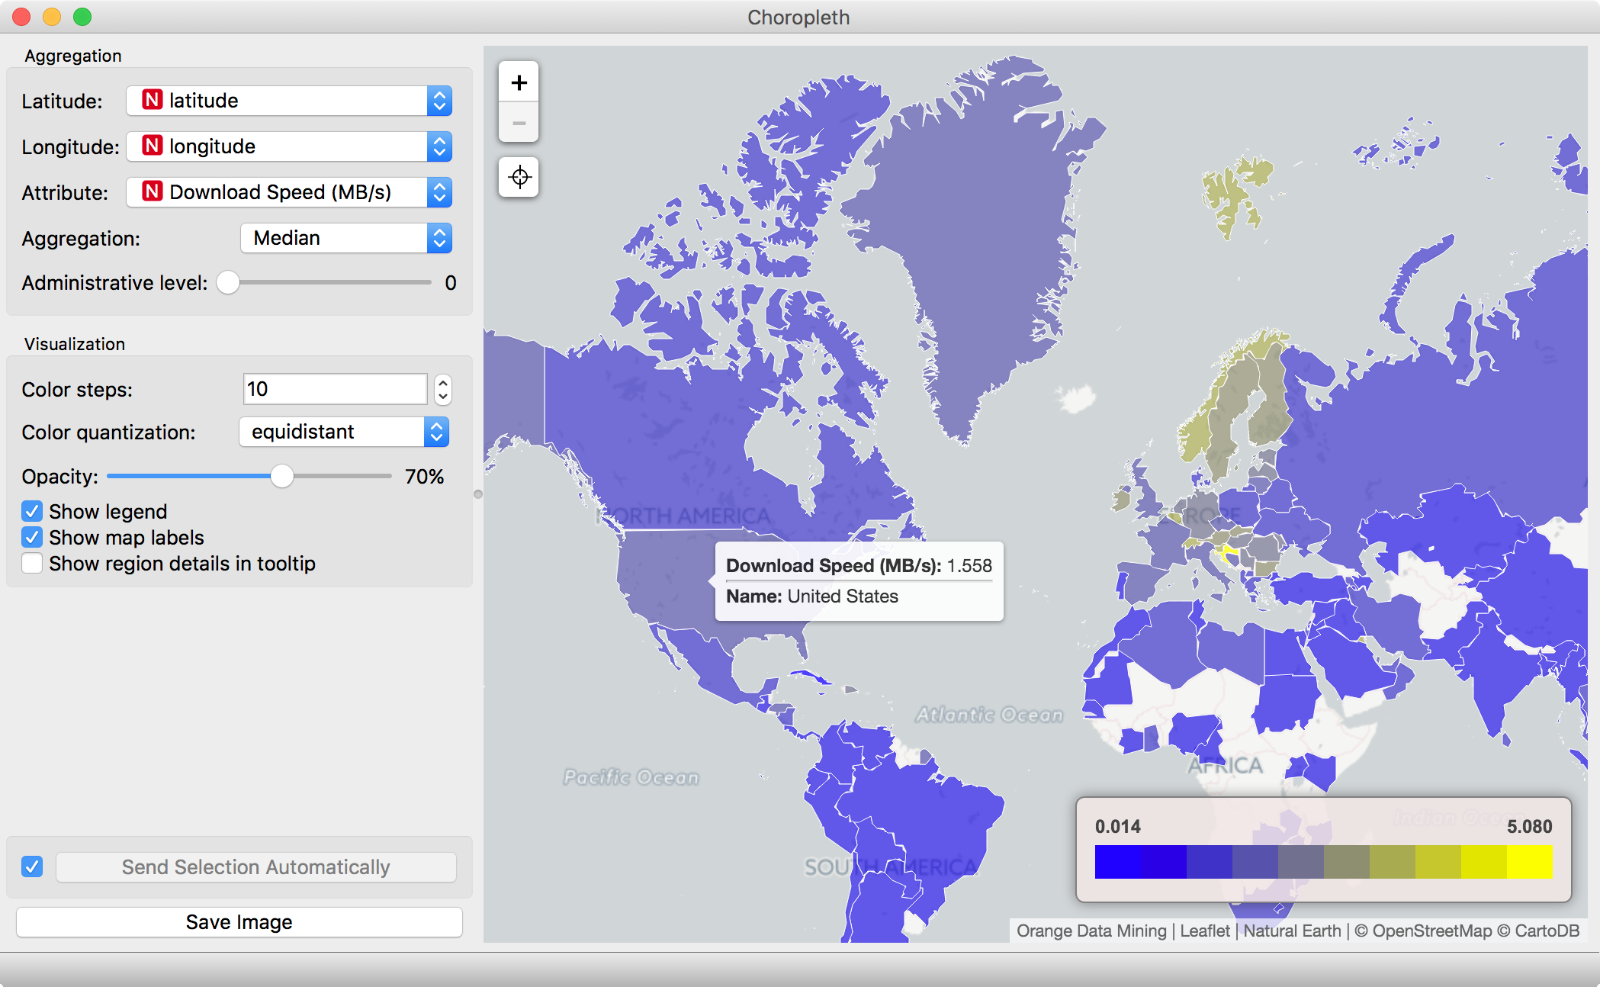
Aggregation by median.
And the longest time someone was prepared to wait for the download? Over 3 hours. Kudos, mate! We appreciate it! 🙌
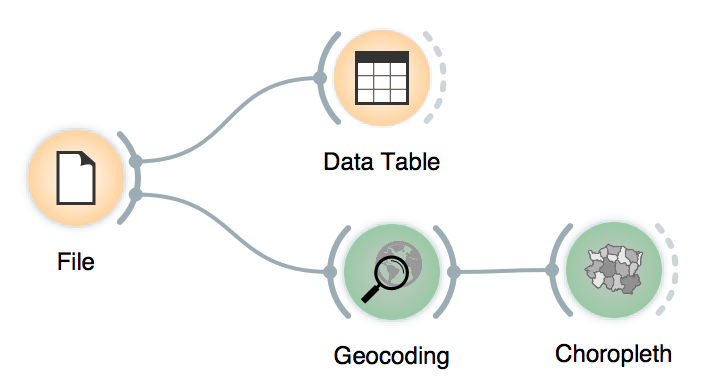
This simple workflow is all it took to do our analysis.
So how is your download speed for Orange compared to other things you are downloading? Better, worse? We’re keen to hear it! 👂
