Classification Trees are great, but how about when they overgrow even your 27’’ screen? Can we make the tree fit snugly onto the screen and still tell the whole story? Well, yes we can.
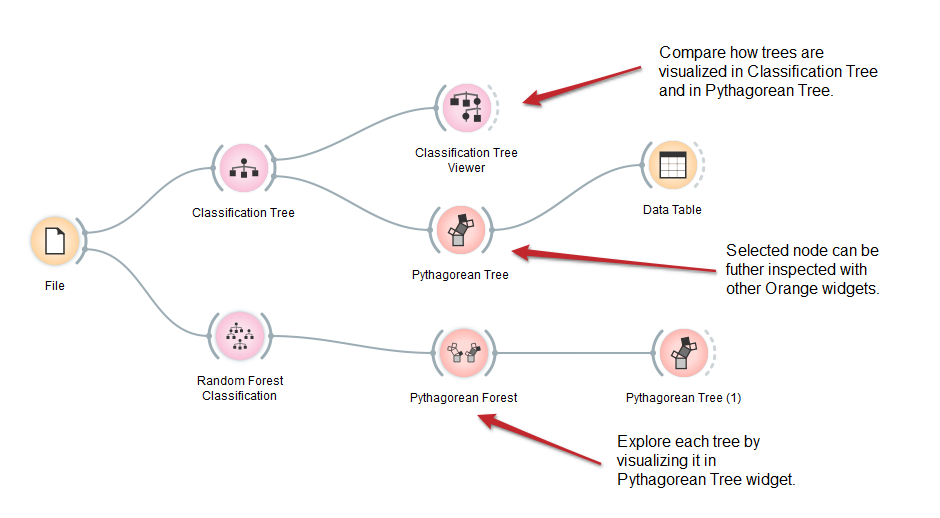
Pythagorean Tree widget will show you the same information as Classification Tree, but way more concisely. Pythagorean Trees represent nodes with squares whose size is proportionate to the number of covered training instances. Once the data is split into two subsets, the corresponding new squares form a right triangle on top of the parent square. Hence Pythagorean Tree. Every square has the color of the prevalent, with opacity indicating the relative proportion of the majority class in the subset. Details are shown in hover balloons.
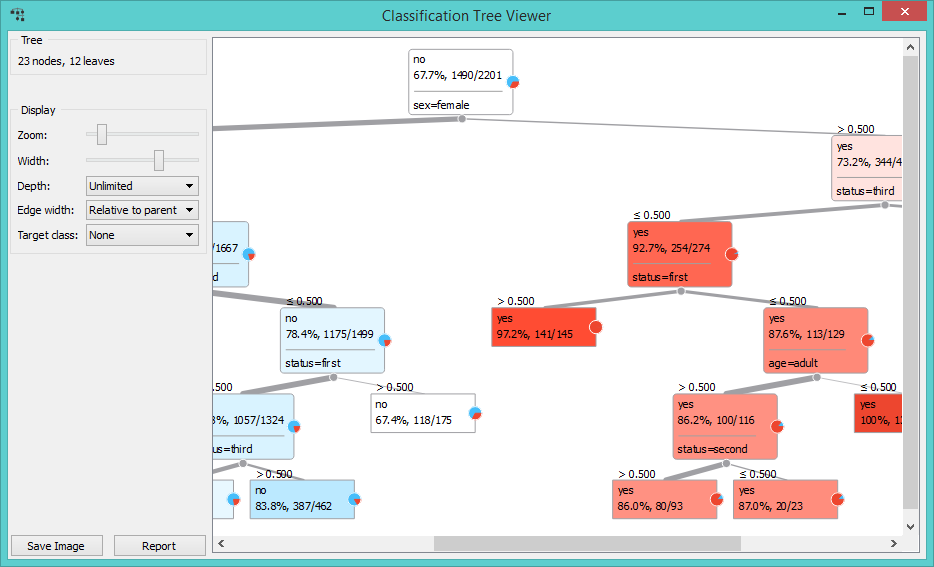
Classification Tree with titanic.tab data set.
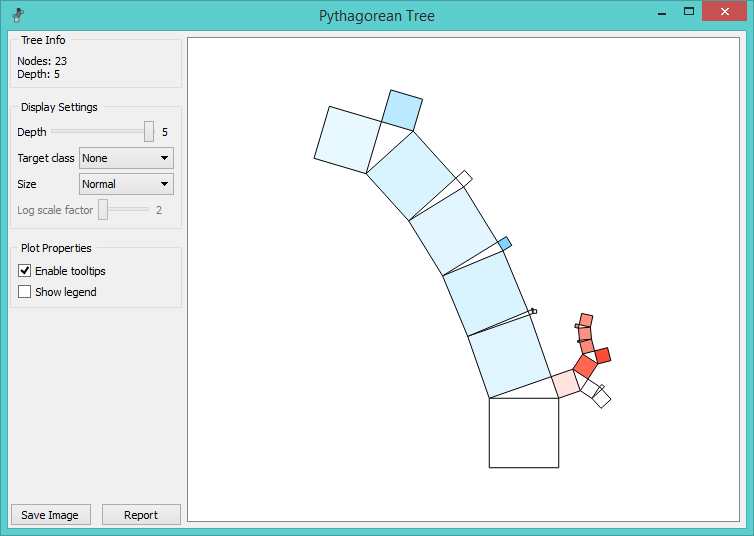
Pythagorean Tree with titanic.tab data set.
When you hover over a square in Pythagorean Tree, a whole line of parent and child squares/nodes is highlighted. Clicking on a square/node outputs the selected subset, just like in Classification Tree.
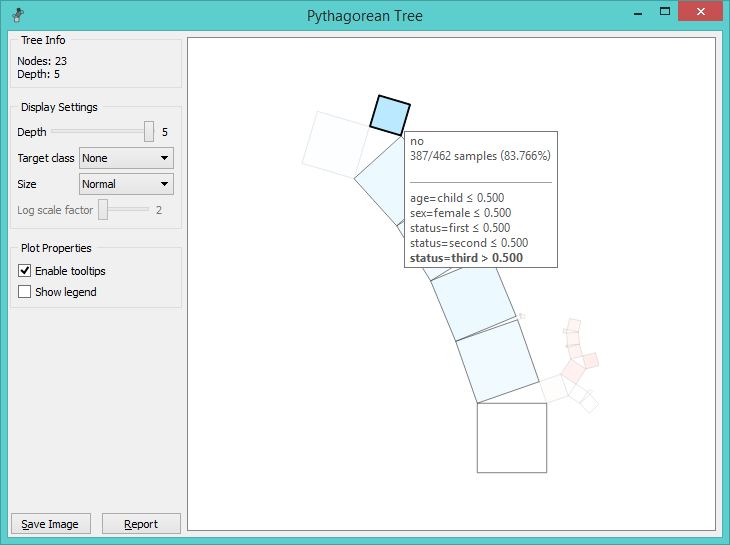
Upon hovering on the square in the tree, the lineage (parent and child nodes) is highlighted. Hover also displays information on the subset, represented by the square. The widget outputs the selected subset.
Another amazing addition to Orange’s Visualization set is Pythagorean Forest, which is a visualization of Random Forest algorithm. Random Forest takes N samples from a data set with N instances, but with replacement. Then a tree is grown for each sample, which alleviates the Classification Tree’s tendency to overfit the data. Pythagorean Forest is a concise visualization of Random Forest, with each Pythagorean Tree plotted side by side.
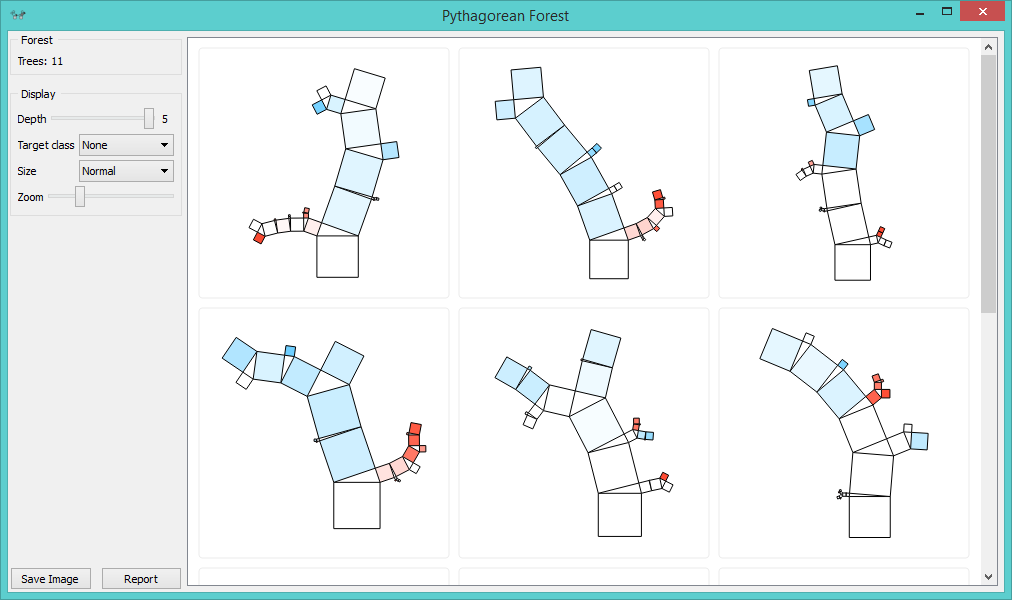
Different trees are grown side by side. Parameters for the algorithm are set in Random Forest widget, then the whole forest is sent to Pythagorean Forest for visualization.
This makes Pythagorean Forest a great tool to explain how Random Forest works or to further explore each tree in Pythagorean Tree widget.
Pythagorean trees are a new addition to Orange. Their implementation has been inspired by a recent paper on Generalized Pythagoras Trees for Visualizing Hierarchies by Fabian Beck, Michael Burch, Tanja Munz, Lorenzo Di Silvestro and Daniel Weiskopf that was presented in at the 5th International Conference on Information Visualization Theory and Applications in 2014.
