I’m sure you’d agree that reporting your findings when analyzing the data is crucial. Say you have a couple of interesting predictions that you’ve tested with several methods many times and you’d like to share that with the world. Here’s how.
Save Graph just got company - a Report button! Report works in most widgets, apart from the very obvious ones that simply transmit or display the data (Python Scripting, Edit Domain, Image Viewer, Predictions…).
Why is Report so great?
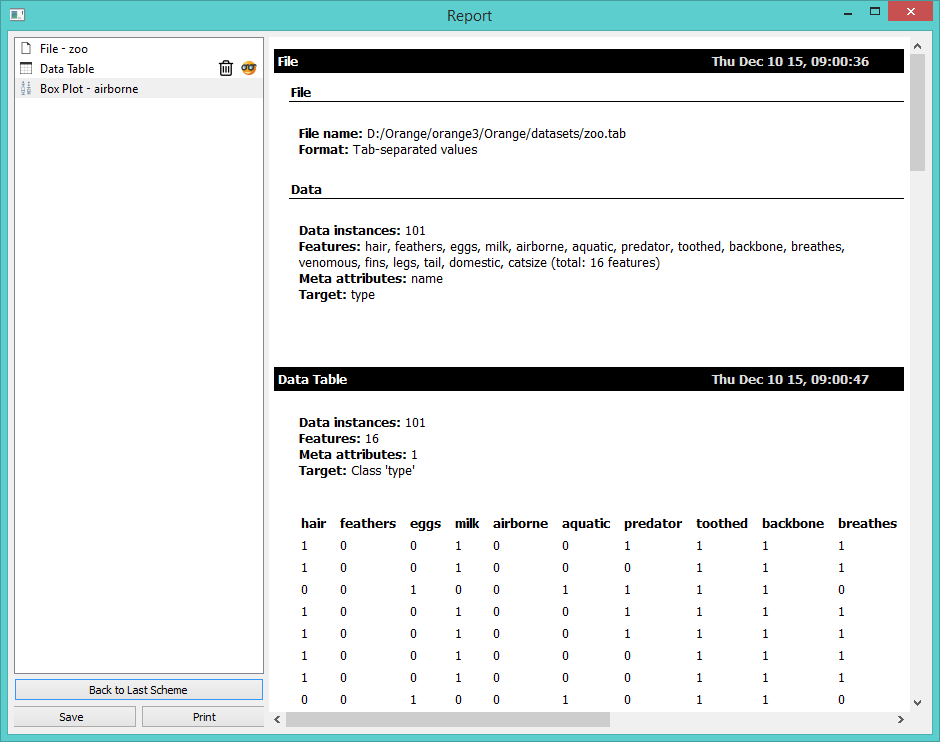
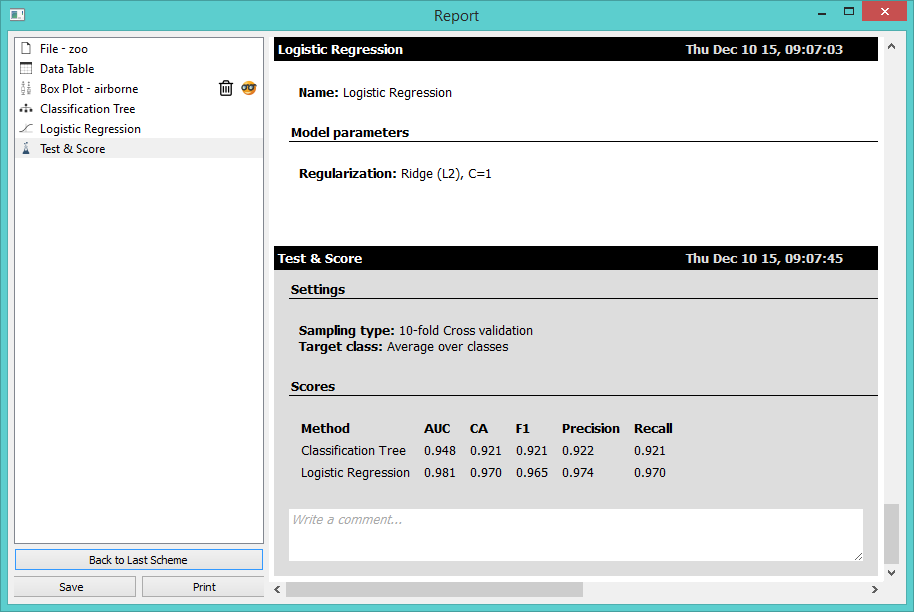
Display data and graphs used in your workflow. Whatever you do with your data will be put in the report upon a click of a button.

Write comments below each section in your workflow. Put down whatever matters for your research - pitfalls and advantages of a model, why this methodology works, amazing discoveries, etc.

Access your workflows. Every step of the analysis recorded in the Report is saved as a workflow and can be accessed by clicking on the Orange icon. Have you spent hours analyzing your data only to find out you made a wrong turn somewhere along the way? No problem. Report saves workflows for each step of the analysis. Perhaps you would like to go back and start again from Bo Plot? Click on the Orange icon next to Box Plot and you will be taken to the workflow you had when you placed that widget in the report. Completely stress-free!

Save your reports. The amazing new report that you just made can be saved as .html, .pdf or .report file. Html and PDF are pretty standard, but report format is probably the best thing since sliced bread. Why? Not only it saves your report file for later use, you can also send it to your colleagues and they will be able to access both your report and workflows used in the analysis.
Open report. To open a saved report file go to File → Open Report. To view the report you’re working on, go to Options → Show report view or click Shift+R.
