Over the summer I worked (and still do) on several new 3D visualization widgets as well as a 3D plotting library they use, which will hopefully simplify making more widgets. The library is designed to be similar in terms of API to the new Qt plotting library Noughmad is working on.
The library uses OpenGL 2/3: since Khronos deprecated parts of the old OpenGL API (particularly immediate mode and fixed-function functionality) care has been taken to use only capabilities less likely to go away in the years to come. All the drawing is done using shaders; geometry data is fed to the graphics hardware using Vertex Buffers. The library is fully functional under OpenGL 2.0; when hardware supports newer versions (3+), several optimizations are possible (e.g. geometry processing is done on the GPU rather than on CPU), possibly resulting in improved user experience.
Widgets I worked on and are reasonably usable:
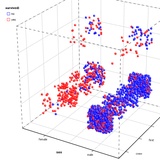
ScatterPlot3D

Its GUI has the same options as the ordinary ScatterPlot (2D),with an additional dropdown for the third attribute (Z) and some new checkboxes (e.g. 2D/3D symbols). The data can be easily rotated, translated and scaled.Supports zoom levels and selections as well. VizRank works.Thanks to hardware acceleration, ScatterPlot3D is quite responsive even with largerdatasets (30k examples).
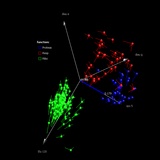
LinProj3D

LinProj3D is displayed using dark theme (themes are available in all 3D widgets).
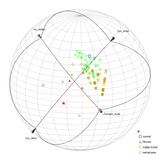
Sphereviz3D

Sphereviz3D has 2D symbols option enabled (also available in all 3D widgets). VizRank has been modified to work with three dimensions; PCA and SPCA options under FreeViz return first three most important components when used in these widgets.
Future
Documentation for widgets and the library is still missing. Some additional widgets are being considered, such as NetExplorer3D.
I wrote few technical details here.
