Open source machine learning and data visualization.
Build data analysis workflows visually, with a large, diverse toolbox.
Open source machine learning and data visualization.
Build data analysis workflows visually, with a large, diverse toolbox.

Oct 20, 2023
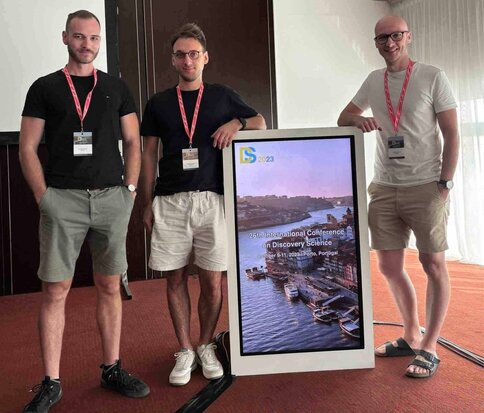
Highlighting our papers from the International Conference on Discovery Science Read more >
Oct 17, 2023
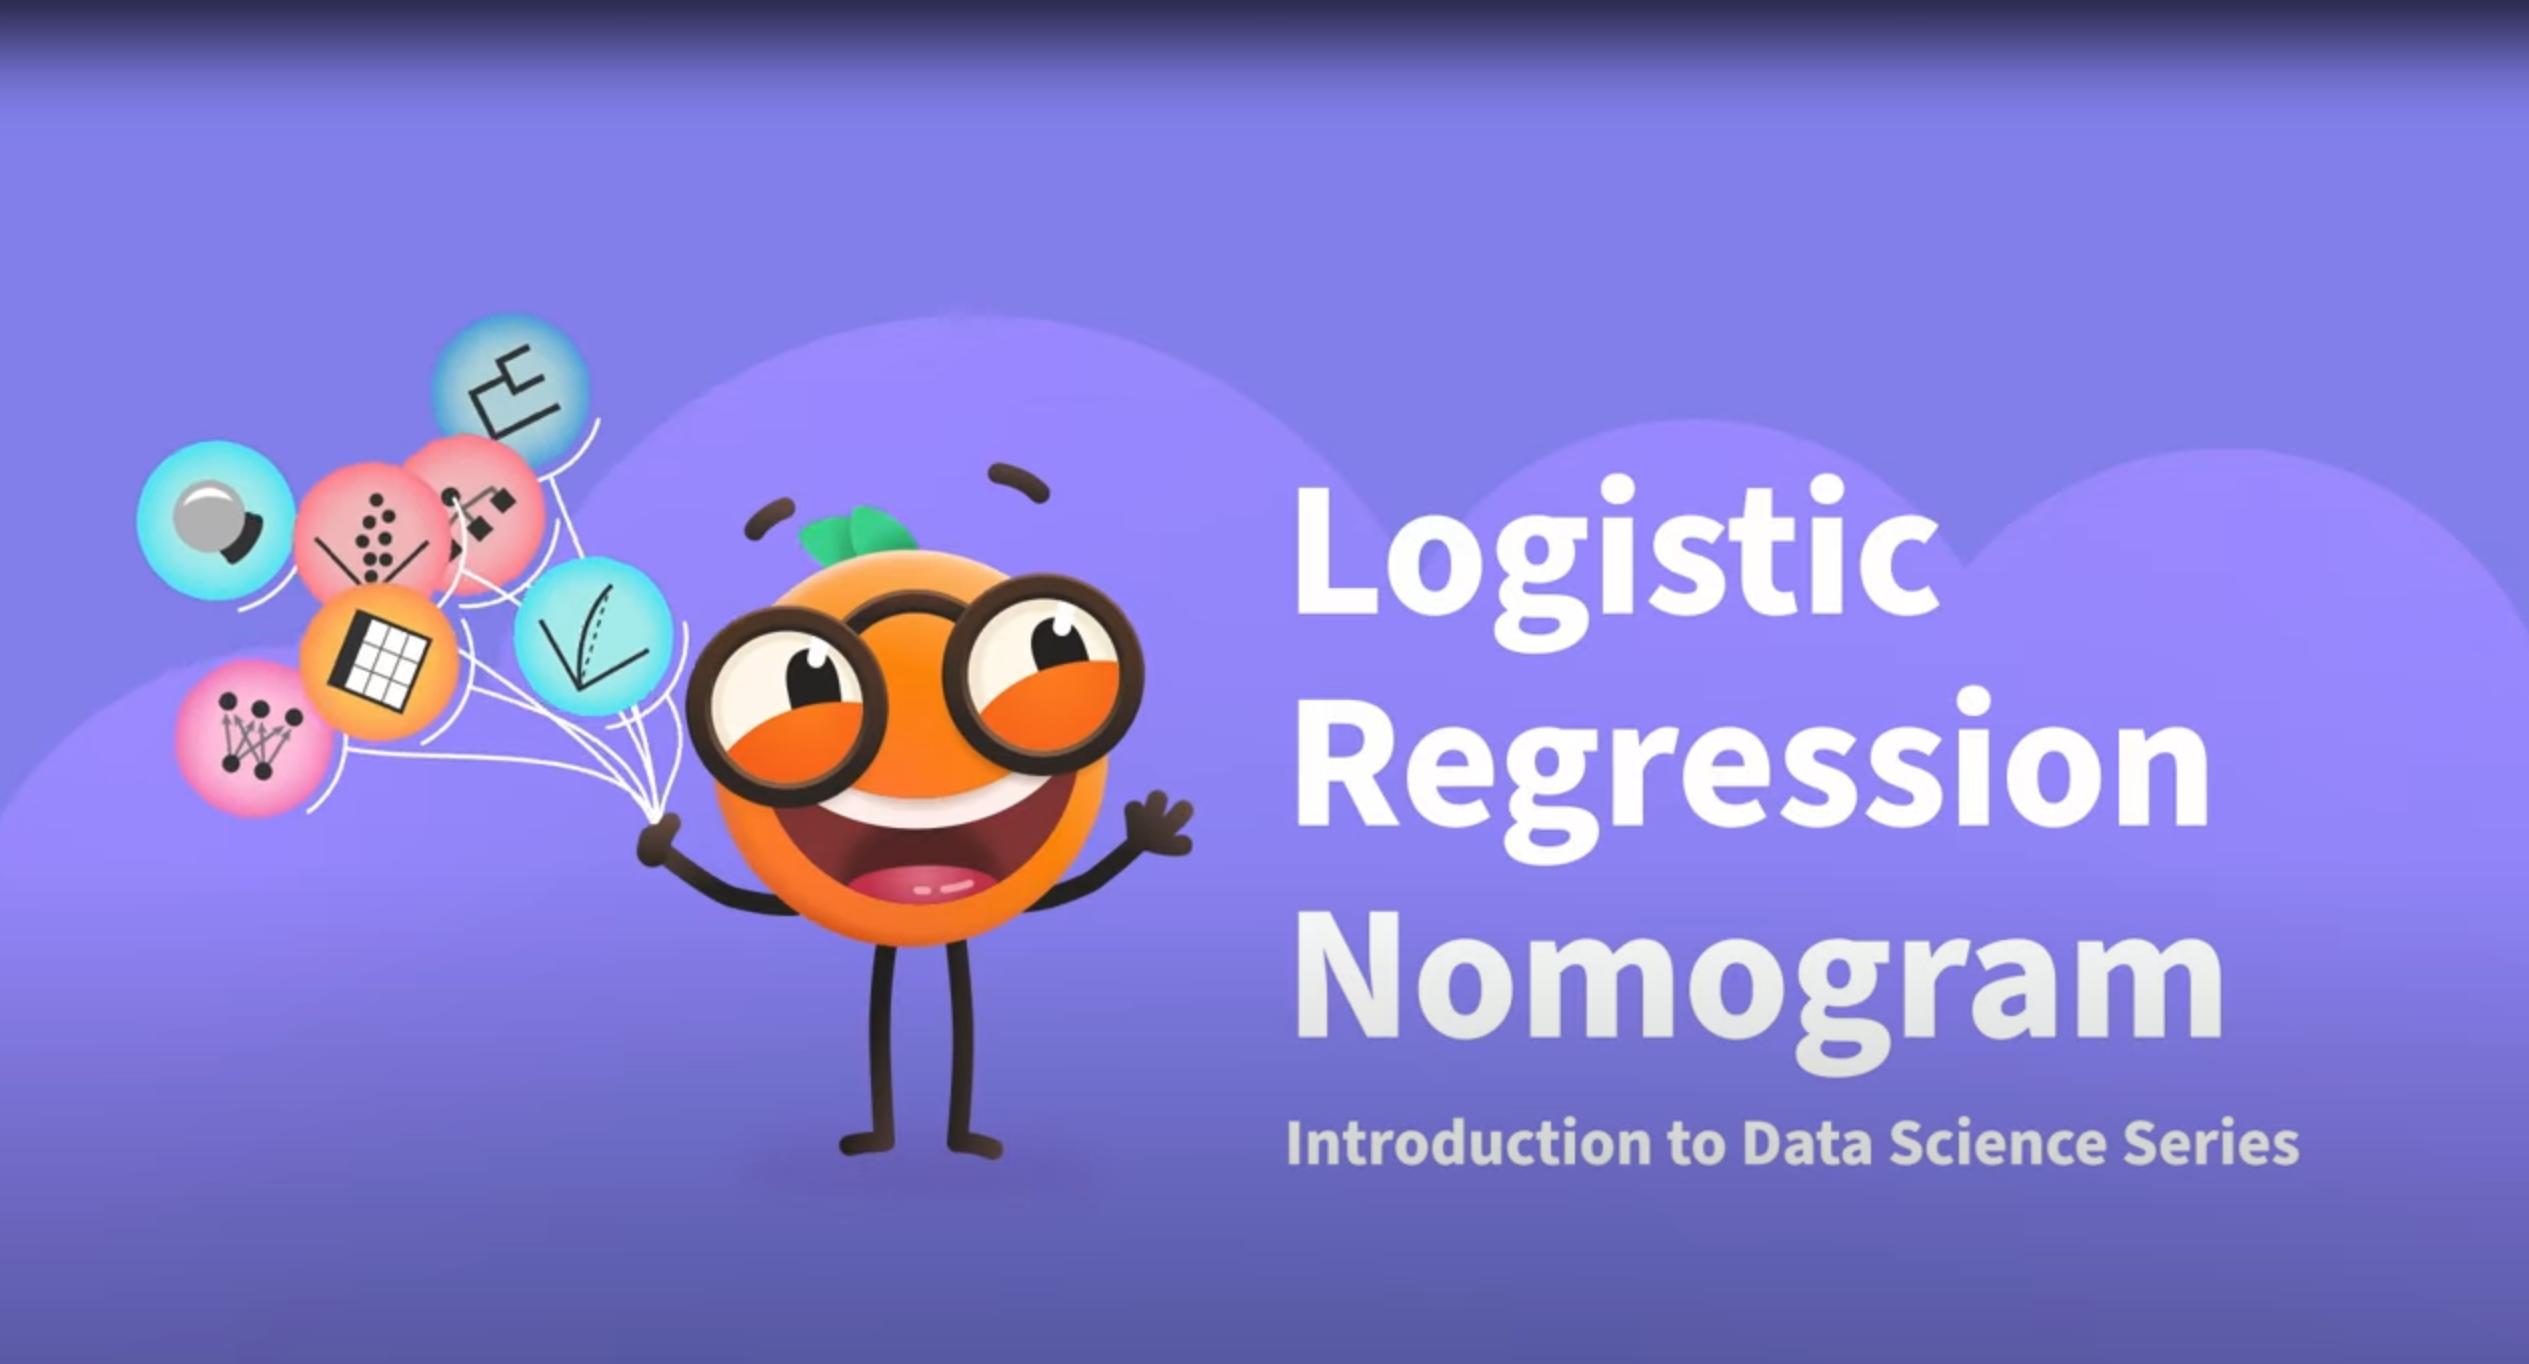
Updates in the Introduction to Data Science Video Series, new video logistic regression nomogram. Read more >
Perform simple data analysis with clever data visualization. Explore statistical distributions, box plots and scatter plots, or dive deeper with decision trees, hierarchical clustering, heatmaps, MDS and linear projections. Even your multidimensional data can become sensible in 2D, especially with clever attribute ranking and selections.
Interactive data exploration for rapid qualitative analysis with clean visualizations. Graphic user interface allows you to focus on exploratory data analysis instead of coding, while clever defaults make fast prototyping of a data analysis workflow extremely easy. Place widgets on the canvas, connect them, load your datasets and harvest the insight!

When teaching data mining, we like to illustrate rather than only explain. And Orange is great at that. Used at schools, universities and in professional training courses across the world, Orange supports hands-on training and visual illustrations of concepts from data science. There are even widgets that were especially designed for teaching.
Use various add-ons available within Orange to mine data from external data sources, perform natural language processing and text mining, conduct network analysis, infer frequent itemset and do association rules mining. Additionally, bioinformaticians and molecular biologists can use Orange to rank genes by their differential expression and perform enrichment analysis.


"The scientific community is in need of tools that allow easy construction of workflows and visualizations and are capable of analyzing large amounts of data. Orange is a powerful platform to perform data analysis and visualization, see data flow and become more productive. It provides a clean, open source platform and the possibility to add further functionality for all fields of science."

"I teach Orange workshops monthly to a diverse audience, from undergrad students to expert researchers. Orange is very intuitive, and, by the end of the workshop, the participants are able to perform complex data visualization and basic machine learning analyses. Most of our attendees have been able to incorporate this tool in their research practice."

"My laboratory produces large amounts of data from RNA-seq, ChIP-seq and genome resequencing experiments. Orange allows me to analyze my data even though I don’t know how to program. It also allows me to communicate with my collaborators, who are experts in data mining, and with my colleagues and trainees."